


1. Introduction
When firn is transformed into air-tight ice by natural sintering of firn grains near the Ice surface, a portion of the surrounding atmosphere becomes trapped in the pores between the grains. The barometric conditions and the gaseous composition of the atmosphere prevailing when the firn pores close off are thus reflected in the volume and composition of the air enclosed in the Ice. Consequently, measurements of gases enclosed in polar ice cores provide valuable information about the past history and environment of the ice sheets, including past surface elevations of the 1ce sheets from the total gas content (Reference Raynaud and LebelRaynaud and Lebel 1979, Reference Raynaud and LebelRaynaud and others 1979, Reference Raynaud and WhillansRaynaud and Whillans 1982), and the evolution of the atmospheric CO2 over the last tens of thousands of years from trie CO2 content (Reference Berner, Oeschger and StaufferBerner and others 1980, Reference Delmas, Ascencio and LegrandDelmas and others 1980).
Nevertheless, a portion of the gases extracted from 1ce may have an origin different from the gaseous atmosphere trapped during ice formation. Solid trace constituents may be decomposed and generate gases during gas extraction. Actually, extraction of gases from 1ce Is the most critical step in the experimental procedure. The aim of this paper 1s to review the different methods tested in our laboratory and to describe and discuss 1n detail those which appear to be the most efficient.
2. Gas Extraction For the Volumetric Determination of the Air Trapped in Ice
The first requirement for measuring accurately the volume of atmospheric air enclosed in ice is to achieve a complete extraction. The total gas content V measured in cold polar ice is of the order of 0.1 cm3 = 100 1m3 STP g−1 of ice. The natural variations observed are generally a few per cent of V. The composition of the total gas is very close to the atmospheric composition, except for CO2. This CO2 deviation, due to the decomposition of contaminating carbonate dust (section 3), is too small (about 0.1% of the total volume) to affect air volume measurements.
For total gas content determinations, we used two extraction methods: melting of ice in kerosene, and extraction of gases in a vacuum. The first method is described in detail by Reference LangwayLangway (1958). The experimental uncertainty is about ±7%. The study of V variations in ice generally requires more accurate measurements, which are obtained by extracting the gases in a vacuum.
We have tested and used the latter method in our laboratory, following several different procedures (Reference RaynaudRaynaud 1977, Reference Raynaud and DelmasRaynaud and Delmas 1977, Reference LebelLebel 1979): (i) sublimating ice, (ii) melting ice, and (iii) melting ice and refreezing the melt water. All these procedures generally lead to accurate (± about 1%) relative measurements, but there are systematic differences between results obtained with different procedures (Reference Raynaud and LebelRaynaud and Lebel 1979). Because of the systematic nature of these differences, the total gas content variations in ice deduced from the results of a single procedure are not affected and V changes obtained by different procedures may be compared. A major difference between the procedures tested is the amount of water vapour in contact with the drying agent (P2O5 or Mg(ClO4)2) or trapped by condensation (in a cold trap) during gas extraction. Gas-solid interactions occurring during trapping of water vapour are probably the main cause of the systematic differences observed between the different procedures.
Currently we use the procedure involving ice melting and refreezing. This procedure reduces considerably the amount of water vapour in contact with the drying agent and is the most efficient (best relative precision and least time-consuming). The analytical method has already been described in Reference LebelLebel (1979) and was used, in particular, for measurements reported by Reference Raynaud and LebelRaynaud and Lebel (1979) and Reference Raynaud and WhillansRaynaud and Whillans (1982).
The main steps in the procedure are as follows, (i) At about -15°C, the ice sample is prepared, weighed accurately (20 to 25 ± 0.01 g) and placed in a glass vessel ((1) in Fig. l). (ii) With the extraction line (Fig. l) pre-evacuated, the glass vessel is connected to the line and evacuated for 20 min through the liquid N2-trap (9). Then the stopcock of (1) is closed and the ice melts, (iii) During melting, most of the gases; escape above the melt water and a certain gas fraction remains dissolved. The water is then slowly refrozen (refreezing time is 30 to 40 mins). Cooling is obtained by the Peltier effect with thermoelectric modules. The bottom of the vessel is especially designed in order to provide a perfect contact with the top of the modules. In this way, dissolved gases migrate towards the ice-water interface as the ice grows and at the end of the refreezing process the vessel contains gas-free ice with the extracted gases above. (iv) The stopcock of (1) is opened again, the extracted air dried through the P2O5 traps (4) and collected in a volumetric gas burette (6) using an automatic Toepler pump (5). During this last step, only a small amount of water vapor is transferred to the P2O5 traps because water in the glass vessel is in the form of ice maintained at low temperature. The traps (4) are filled with granular P205 To obtain reproducible results, the P2O5 has to be changed after about 20 extractions.
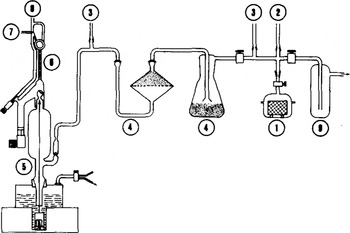
Fig.1. Standard gas extraction line used for total gas content and CO2 measurements. (1) sample vessel, (2) inlet for gas calibration, (3) Pirani gauge, (4) P205-trap, (5) Toepler pump, (6) gas burette with divisions of 0.02 cm3 STP, (7) outlet towards the gas chromatograph, (8) outlet towards the atmosphere, (9) liquid N2-trap.
The amount of gas that can be extracted by a second ice melting-controlled refreezing cycle is negligible (0.1 to 0.3% of the total amount of gas) and we can assume that gas extraction is complete after only one cycle.
Sources of experimental error in the relative measurements of total gas content in ice are mainly the amount of ice sublimated when the glass vessel (1) is first evacuated and the accuracy of the volumetric burette. The influence of these sources of error was evaluated experimentally and the corresponding experimental error on the V results is <±1%.
To check the relative precision of our measurements, we performed comparative determinations of V on natural samples which are assumed to enclose very similar amounts of air (Reference Raynaud and LebelRaynaud and Lebel 1979). The difference between comparable measurements never exceeds 2% and is on the average 0.7%.
3. Gas Extraction and CO2 Content in Polar Ice
3.1 Carbonates and the contamination problem
concentration of 340 parts per million by volume (vpm) and a total gas content in ice of 0.1 cm3 STP g−1, the calculated volume of CO2 in 1 kg of 1ce would be 34 μl of CO2, i.e. 1.5 μmol. This value is comparable with the concentrations (range 0.5 to 4 μmol kg−1) of the other major trace constituents or ions (H+, S04 2-, N03 −, C1−, Na) generally found In Antarctic ice (Delmas and others 1n press). The determination of chemical concentrations at such low levels Is very difficult, mainly because of contamination problems during sampling, sample handling, and laboratory work.
In the case of major atmospheric gases (N2, O2, Ar, and CO2), such problems have been disregarded until now. However, the case of CO2 is special as 1t can be generated from carbonates. Carbonate Is a common constituent of continental dust, particularly in sedimentary areas where It Is a significant neutralizing agent of natural atmospheric acids. If care is not taken in sample preparation, carbonate dust may be inadvertently Incorporated In the Ice, most likely in the form of solid particles deposited on the surface.
If the gases are extracted by ice melting, carbonated particles remain in the melt water 1n a soluble or insoluble form. These particles may then slowly react with the natural acidity of the sample or be rapidly destroyed by sulphuric acid which may be added to the melt water In order to improve extraction of CO2 (Reference Raynaud and DelmasRaynaud and Delmas 1977).
When a carbonate (CO32-) or bicarbonate (HCO3-) dissolves in acidic water, the following equilibria occur:
The more acid the solution, the more easily these equilibria are displaced to the right and CO2 1s freed. It can be calculated that 106 μg (1 pmol) of sodium carbonate decomposes giving 22 μl (STP) of CO2. This value must be compared to a “normal” CO2 content of ice (~34 μl of CO2, 1.5 μmol). If special care is not taken 1n handling the ice sample, a contamination of 1 μmol is very feasible. In this case, the measured CO2 content is Increased by 66%.
Our present knowledge of the chemical composition (Delmas and others in press) of Antarctic snow clearly demonstrates that natural carbonates are highly improbable in snow, particularly at central Antarctic locations, and have never been detected in clean samples (Reference LegrandLegrand 1980). Only contaminated samples have been found to be carbonated. This contamination was assessed by titrating in detail the carbonate or acid content of an 1ce core (Dome C, 111 m depth). It was shown that it 1s a typical surface contamination, probably caused by handling the sample in the cold room during band-saw trimming. The sample (a cube of Ice) was placed in a clean glass funnel and allowed to melt slowly. Several successive melt-water fractions were recovered and titrated separately. The titration method used, which was developed in our laboratory (Legrand and others to be publishedFootnote *), measures the concentrations (±0.2 μEquiv. L−1) of strong adds (pH<7) or of (bi)carbonates (pH>7) in natural precipitations. In this titration method, the influence of atmospheric CO2 is eliminated.
The diagram in Figure 2 clearly demonstrates that the external part of the ice sample is heavily contaminated and that the “normal” acidity of the ice can be obtained only by analysing the inner core of the sample cube. By adding the (bi)carbonate found for each fraction, we calculate a corresponding total amount of CO2 of nearly 2.2 μmol, an amount which can be compared to that which is assumed to be in the air bubbles (1.5 μmol). This comparison clearly shows that the measured carbonate contamination may easily double the natural CO2 content of the ice. In this particular case, the CO2 content determined after melting the sample and extracting the gases would probably be higher than 800 vpm.
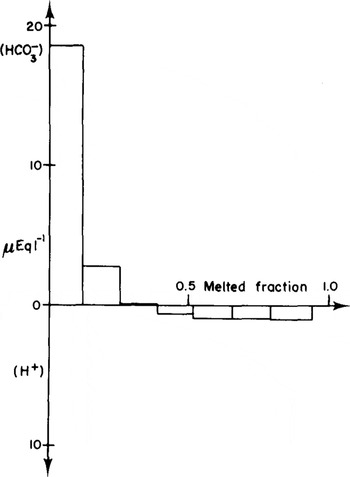
Fig.2. Study of the superficial carbonate contamination of an ice-core sample. The first fractions of melt water recovered contain (bi)carbonates. The inner part of the core is slightly acid and is most probably free of contamination.
When the sample 1s not prepared just before gas extraction, contamination may be even more important and explain the very high CO2 values found by Reference Raynaud and DelmasRaynaud and Delmas (1977) for certain levels in the Camp Century core. On the other hand, if the volume of the sample is bigger (300 g, for example (Reference Berner, Oeschger and StaufferBerner and others 1980)), surface contamination may be reduced and corresponding excess CO2 lowered. It must be noted that the long complete extraction times (>1 h) reported by these authors is most probably explained by slow destruction of the carbonated particles and displacement of the above chemical equilibria (Reference Stumm and MorganStumm and Morgan 1970) by the natural acidity of the melt water. The composition of the “first fraction” (as defined by Berner and others (1980)) can be assumed to approximately reflect that of the bubbles.
We therefore conclude that excess CO2 generally measured when gases are extracted by melting ice is satisfactorily explained by inadvertent contamination of ice samples during preparation. Furthermore, dispersion of the CO2 values thus obtained could be also linked to this artifact.
Preparation of samples in ultraclean conditions at -15°C being difficult, we tried to wash thoroughly the solid sample with a pure liquid (alcohol, deionizdeionized water, and acidified deionized water were used) in order to remove superficial contaminated ice layers. The CO2 content of the extracted gases was considerably lowered. It seemed, however, that a residual contamination still remained (Reference Delmas, Ascencio and LegrandDelmas and others 1980).
3.2 Crushing the ice
We have developed a gas extraction method where the ice remains in the solid state in order to recover only the bubbles. By this means, the solid carbonates and the natural acids of the ice are not allowed to react and to free excess CO2.
The ice samples are cut from the centre of the core with a band-saw. Their weights are in the range 30 to 50 g. All operations are done in a cold room (cutting at -15°C, crushing at -40°C). The stainless steel cylindrical container (volume 150 ml), in which the ice is crushed, has two distinct parts (Fig.3).

Fig.3. Stainless-steel container used to crush ice samples and recover air from the bubbles.
A stopcock was fitted at the top of the upper part. The assembly of the two parts is made airtight using an indium wire. Stainless-steel balls are added to the solid sample. The air is rapidly evacuated by connecting the container, maintained at about -40°C, to the vacuum line (10−2 torr). The evacuated vessel is then closed, transferred to the cold room and mounted on the crushing apparatus. This apparatus acts by imparting an up-and-down motion (several hundred cycles min−1) to the vessel. The ice is very finely pulverized by the metal balls. The optimal crushing time was determined experimentally (Fig. 4). After 30 s the amount extracted is relatively small. Note that the CO2 content measured depends neither on extraction rate nor on crushing time. This shows that a total extraction of the air bubbles is not necessary to get reproducible CO2 values. Finally, by adding a small amount of NaHC03 powder to the ice sample just before crushing, it was checked that solid contaminants do not alter the CO2 measurements.
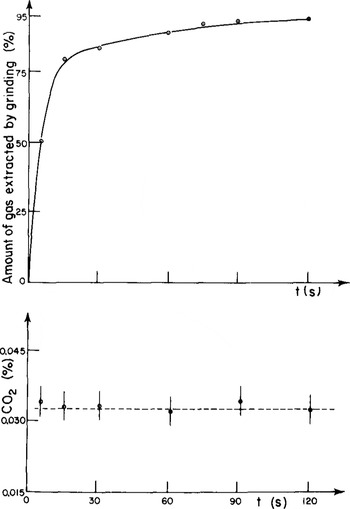
Fig.4. Extraction rates and CO2 content of gases extracted after Increasing crushing times (Dome C ice, 111 m depth).
After crushing, the stainless-steel container (maintained at about -40°C) is connected to the extraction line. Extracted gases are dried and collected in the gas burette as described in section 2. CO2 concentrations are measured by gas chromatography (Silicagel column, thermistor detector). The method is calibrated by using synthetic air standards with CO2 contents in the 150 to 400 vpm range. The overall error of the method is estimated to be about 10%Footnote *.
This procedure was used by Reference Delmas, Ascencio and LegrandDelmas and others (1980) in order to describe past variations of atmospheric CO2. CO2 values thus obtained from ice (160 to 350 vpm) bracket the present-day CO2 atmospheric content. Furthermore, very similar profiles (CO2 concentrations vs age) were obtained at two different Antarctic locations. These results are a good indication that the CO2 variations in the air bubbles of polar ice are related to the composition of the past atmosphere.
4. Conclusion
for measuring the volume of atmospheric air trapped in polar ice, the most suitable and reproducible gas extraction method tested in our laboratory consists of melting the ice and controlled refreezing of the melt water in a vacuum.
In the case of CO2 measurements in ice, carbonate contamination during sample preparation satisfactorily explains the high CO2 values formerly observed. This contamination precludes the use of gas extraction methods involving ice melting, at least in the case of small samples. Ice crushing in a vacuum appears to be the most suitable means of obtaining consistent past atmospheric CO2 values from polar ice.
Acknowledgements
This work was partly undertaken through a contract with the European Economic Community.


