
Abstract
Arctic snowpacks are often considered as chemical reactors for a variety of chemicals deposited through wet and dry events, but are overlooked as potential sites for microbial metabolism of reactive nitrogen species. The fate of deposited species is critical since warming leads to the transfer of contaminants to snowmelt-fed ecosystems. Here, we examined the role of microorganisms and the potential pathways involved in nitrogen cycling in the snow. Next generation sequencing data were used to follow functional gene abundances and a 16S rRNA (ribosomal ribonucleic acid) gene microarray was used to follow shifts in microbial community structure during a two-month spring-time field study at a high Arctic site, Svalbard, Norway (79° N). We showed that despite the low temperatures and limited water supply, microbial communities inhabiting the snow cover demonstrated dynamic shifts in their functional potential to follow several different pathways of the nitrogen cycle. In addition, microbial specific phylogenetic probes tracked different nitrogen species over time. For example, probes for Roseomonas tracked nitrate concentrations closely and probes for Caulobacter tracked ammonium concentrations after a delay of one week. Nitrogen cycling was also shown to be a dominant process at the base of the snowpack.
Export citation and abstract BibTeX RIS

Content from this work may be used under the terms of the Creative Commons Attribution 3.0 licence. Any further distribution of this work must maintain attribution to the author(s) and the title of the work, journal citation and DOI.
1. Introduction
Anthropogenic nitrogen has been recognized as one of the key pollutants in the Arctic for over a decade [1]. Nitrogen (N) exists in different forms in the environment, as an inert gas (N2), but also as biologically, photochemically and radiatively active compounds. These include reduced inorganic (ammonium and ammonia) and oxidized inorganic forms (e.g., nitrate, nitrite, nitric acid and nitrogen oxides) as well as generally reduced organic compounds (e.g., urea, amines, proteins). Before the mass industrial production of nitrogen compounds for agricultural and industrial activities, reactive forms of nitrogen did not accumulate in the environment because processes involved in N2 fixation and its subsequent denitrification were in balance [2]. However, recent evidence has shown that these compounds are now accumulating at rates faster than their removal, thus potentially altering ecosystem functioning [3], with sensitive Arctic ecosystems especially at risk.
Snowpacks are important components of the cryosphere. Snow acts as a heat sink as well as a ground insulator [4] and its extent and thickness influences subsurface soil temperatures and soil metabolic activity [5]. Its insulating properties protect soil surface organisms, such as vegetation, invertebrates and mammals against frost damage [4]. However, the role of the snowpack is not limited to insulating the underlying soil from the atmosphere. Arctic snowpacks are chemically dynamic [6] and have been shown to act as chemical reactors that significantly influence the reactive chemistry and composition of the overlying atmosphere [7]. Snowpacks also store nutrients, soluble inorganic or organic matter and contaminants, such as anthropogenic nitrogen delivered by both wet and dry deposition [8, 9]. This nitrogen is then preferentially eluted in the form of nitrate with the first melt water [10]. The chemical transformations that might occur within the snowpack have yet to be completely elucidated. While the photochemical cycling of reactive nitrogen species has been documented [11, 12], the role of snow microorganisms has been mostly neglected, with the exception of a few reports [13, 14]. The effects of reactive nitrogen deposition on soil microbial communities has been studied extensively [15], but little is known about its impact on snow microbial communities.
The view of the snowpack as a biotically inert system has begun to be revisited. Snowpacks are habitats able to sustain microorganisms [16], that display diversities which in some cases approach that of temperate soils and lakes [17]. Snow supports a diverse microbial community composed of algae, fungi and bacteria [17–21]. Despite the low temperatures and limited liquid water supply, microbial communities inhabiting the snow cover are likely dynamic as recently suggested by the observation of a correlation/link between microbial community structure and snow chemistry [22]. The dependence of these microbial communities on different nitrogen species and the functional response to nitrogen deposition remain unexplored. A recent report by Amoroso et al [14] suggested that the winter-time atmospheric N signal could only be attributed to snowpack microorganisms that were metabolizing deposited reactive N [14].
A recent paper by Weedon et al [23] highlighted the importance of measuring enzyme activity in understanding both the mechanisms involved in, and the response of the soil N cycle to environmental stress. However, before attempting such measurements, it is crucial to determine which, if any, N cycling pathways are being carried out in a given environment. Here, we identify the potential microbially-mediated nitrogen transformation pathways that might occur in an Arctic seasonal snowpacks in the spring. We revisited a chemical and microbial data set collected from Svalbard [24] and linked these to next generation sequencing data. We reveal key enzyme complexes and link changes in relative microbial abundance to different N species and discuss the potential implications for Arctic ecosystems.
2. Methods
The spring research campaign was held between 16 April 2008 and 8 June 2008 at Ny-A˚lesund in the Spitsbergen Island of Svalbard, Norway (78°56'N,11°52'E). The field site, a 50 m2 perimeter with restricted access (to reduce contamination from local human sources), is located along the south coast of the Kongsfjorden, which is oriented SE-NW and open to the sea on the west side. The Kongsfjorden was free of sea ice throughout the campaign, which covered most of the spring-time season up until the almost complete melt of the snowpack. The snowpack developed over tundra covered by a 10 cm thick ice layer and was 45 cm thick at the onset of sampling.
3. Sampling
Twice a week, a shallow pit (45 cm at the beginning of the field season) was dug in the seasonal snowpack and both surface (3 cm) and basal snow samples (10 cm above the ground) were collected for ion and microbial analyzes. A total of 39 samples were collected. Samples for ion measurements (major, minor ions and organic acids) were collected directly in sterile cuvettes and stored at −20 ° C until analysis. Samples for microbial analyzes were collected in three 3 l sterile sampling bags (a total of 9 l of snow or roughly 3 l water equivalent) using a sterilized Teflon shovel. Of the 39 samples collected, nine were selected for 454 pyrosequencing. To minimize contamination, Tyvex® body suits and latex gloves were worn during sampling and gloves were worn during all subsequent sample handling. Snow and meltwater chemistry and microbiology as well as sample handling and analysis have been described previously [6, 24], but are summarized in the following section.
3.1. Microbial sample processing and DNA extraction
Samples were processed immediately after collection in the field laboratory and were left to melt (6 h) at room temperature prior to being filtered onto sterile 0.22 μm 47 mm filters (Millipore) using a sterile filtration unit (Nalge Nunc International Corporation). Between 2 and 3 l of melted snow were filtered per sample. Filters were stored and transported to the laboratory in France in sterile bead-beating tubes at −20 ° C until further analysis. Procedural blanks were carried out by filtering Nanopure water (Siemens) using the same procedure. DNA was obtained from the filters using Fastprep® bead-beating tubes (Lysing matrix E, MP Biomedicals) and a Fastprep® bead-beater (MP Biomedicals). DNA was extracted from the aqueous phase with an equal volume of chloroform: isoamyl alcohol (24:1) and precipitated with isopropanol. Detailed descriptions of the method are provided in [24].
3.2. DNA taxonomic microarray analysis
The Agilent Sureprint Technologies microarray format was used, and consisted in 8 identical blocks of 15 000 spots each on a standard glass slide format 1'' × 3'' (25 mm × 75 mm). A total of five slides were used for the hybridization of all samples. Probes were designed to target the rrs gene and to cover different taxonomic levels from a wide part of the Bacteria and Archaea phylogenic tree using the ARB software package. Details concerning microarray design and DNA amplification are provided in [24, 25]. Briefly, rrs genes were amplified by PCR from total DNA extracted from each sample, using universal primers pA (5' AGAGTTTGATCCTGGCTCAG 3') and pH-T7 (5' AAGGAGGTGATCCAGCCGCA 3') (universal for most Bacteria and some Archaea) and the illustra Hot Start Mix RTG (GE Healthcare) PCR kit. The PCR conditions used were 3 min at 94 ° C, followed by 35 cycles of 45 s of denaturation at 94 ° C, 45 s of annealing at 55 ° C, and 90 s of elongation at 72 ° C. After a final 5 min extension 72 ° C, PCR products were separated by 1%-agarose gel electrophoresis, purified using the NucleoSpin® Extract II kit (Clontech) and transcribed. In vitro transcription was carried out at 37 ° C during 4 h in 20 μl reactions that contained 8 μl of the purified PCR product (50 ng μl−1) and 12 μl of the following mix: T7 RNA buffer (5×), DDT (100 mM), 10 mM of each of the four NTPs, RNasin (40 U μl−1), T7 RNA polymerase (1 μl) and UTP-Cy3 (5 mM). In vitro transcription was carried out at 37 ° C during 4 h. RNA was purified using the Quiagene RNeasy mini Kit according to the manufacturer's instructions and quantified with a nanophotometer before undergoing chemical fragmentation. The RNA solution was then diluted to 5 ng μl−1 and a hybridization mix was prepared (v/v ratio) in a 50 μl reaction with 2× GeX Hyb Buffer (Agilent). A total of 100 ng of RNA were then placed on the slide and incubated at 60 ° C overnight in the Agilent Hybridization Oven. Microarray were washed with the GE wash Buffer kit (Agilent) according to the manufacturer's instruction, and dried by one minute incubation in acetonitrile. An Innoscan 700 scanner (Carbonne, France) was used for scanning microarray slides according to the manufacturer's instructions.
3.3. Pyrosequencing of snow samples
The DNA (2 μg 50 μl−1) extracted from environmental samples was pyrosequenced by GATC (Constance, Germany) using a Roche 454 Titanium pyrosequencer. Nine samples (seven surface and two basal samples) distributed throughout the sampling season were selected for pyrosequencing. The selection process was based on clustering data from both the chemical and 16S rRNA gene microarray data sets such that members of different clusters were represented in the pyrotag run. Since the required amount of DNA for pyrosequencing is high (2 μg 50 μl−1), the metagenome extracted from each sample for pyrosequencing was amplified using multiple displacement amplification with the illustra™ GenomiPhi™ V2 DNA Amplification Kit (GE Healthcare). Amplification was carried out according to the manufacturer's instructions. The fasta sequences obtained were filtered for errors using cd-hit, blasted against the NCBI-NR database using the BLASTX default settings [26, 27] and analyzed using MEGAN 4.69 [28]. Data were also annotated in MG-RAST [29] to allow for comparisons with publicly available metagenomes from various ecosystems (see [30] for details of the methodology and a description of the different ecosystems compared).
3.4. Chemical analyses
An in-depth discussion on the snowpack chemical characteristics and analysis is provided in [6]. We used the nitrogen chemical species data from this data set to explore N cycling in more detail. Briefly, inorganic ion (NO3−,NO2−,Cl−,SO42−,NH4+,Ca2+,Na+,K+ and Mg2) concentrations were measured at the Laboratoire de Glaciologie et Géophysique de l'Environnement by conductivity-suppressed Ion Chromatography using a Dionex ICS 3000.
3.5. Statistics
4. Results and discussion
Nitrogen cycling is a complex process in which microorganisms have been shown to play an active role [32]. While the nitrogen biogeochemical cycle has almost been completely elucidated in a variety of ecosystems such as oceans and soil, little is known about how nitrogen is cycled in snowpacks with the role of snow microorganisms being almost completely overlooked. Microbial transformations of N require the presence of N chemical species, the organisms able to carry out the specific function as well as the enzyme complexes required for catalysis. In order to identify pathways for N metabolism in the snow, we coupled chemical, taxonomic and functional data and compared these to an established, simplified model of the N cycle (figure 1).
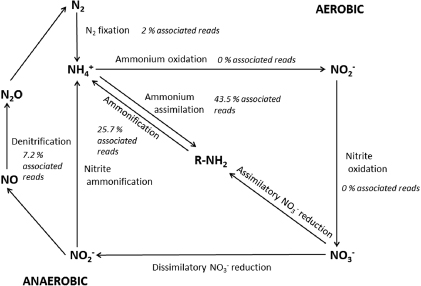
Figure 1. Simplified schematic of the nitrogen cycle with the percentage of associated reads identified in the snow metagenomes.
Download figure:
Standard image High-resolution image4.1. Nitrogen species dynamics in the snow
Based on previous work describing the interaction between chemistry and microbial community structure [24], we were able to observe that the snowpack is stratified in terms of its chemistry and metabolic potential. A detailed description of the evolution of the snowpack is described elsewhere [6], but the snowpack was 45 cm thick at the beginning of sampling and 20 cm thick when the last basal samples were taken before the snowpack melted completely. Probes targeting organisms with the potential to carry out nitrogen cycling were more represented at the base of the snowpack [24] and basal samples were enriched in N chemical species relative to surface samples [6]. Based on the pyrosequencing data, functional genes associated with N cycling were identified in all sample types (table 1). From the chemical data, we observed atmospheric transport and both dry and wet deposition of NH4+,NO3− and NO2− to the surface of snowpacks. For example, the late peak in NO3− levels observed in surface samples was related to a fresh snowfall event (figure 2). The sampling frequency, however, did not allow for the observation of rapid photochemical processes occurring at the snow–atmosphere interface (such as NO3− photolysis and redeposition as HNO3, or NO2− photolysis). The nitrogen species varied as a function of time in the snow cover (figure 2). This is consistent with other reports that suggest that the main N input to snow systems is atmospheric deposition, specifically wet deposition [33, 34]. The changes in N chemical species at the base of the snowpack are likely due to a combination of physical, chemical and potentially microbial processes, including transfer from the surface of the snowpack (by elution, burial and wind pumping) and in situ production (figure 2). The nitrogen cycling observed at the base of the snowpack is probably unrelated to photochemistry given that UV wavelengths are quenched within the first few centimeters of the snow [35]. However, photosynthetically active radiation (PAR) has been measured up to a depth of 2 m, implying that photoactive responses, such as photosynthesis, can occur at the base of snowpacks [36].
Table 1. Amount of pyrosequencing reads per sample for the various steps involved in nitrogen cycle transformations (SEED annotation, functional level 2). Only transformations observed in the snowpack are presented.
| Sample id | Snow type | Total N associated reads | Nitric oxide synthase | Ammonia assimilation | Nitrosative stress | Denitrification | Nitrogen fixation | Nitrate and nitrite ammonification |
|---|---|---|---|---|---|---|---|---|
| SVN7 | Surface | 398 | 5 | 70 | 223 | 15 | 5 | 75 |
| SVN8 | Basal | 402 | 37 | 145 | 15 | 44 | 14 | 125 |
| SVN18 | Surface | 446 | 43 | 256 | 7 | 21 | 21 | 70 |
| SVN35 | Surface | 356 | 9 | 181 | 18 | 0 | 0 | 105 |
| SVN40 | Surface | 215 | 14 | 57 | 0 | 29 | 0 | 86 |
| SVN48 | Surface | 286 | 0 | 118 | 0 | 24 | 24 | 72 |
| SVN56 | Surface | 330 | 38 | 165 | 0 | 39 | 10 | 68 |
| SVN64 | Surface | 269 | 13 | 204 | 13 | 0 | 0 | 39 |
| SVN65 | Basal | 1059 | 80 | 394 | 167 | 121 | 0 | 393 |
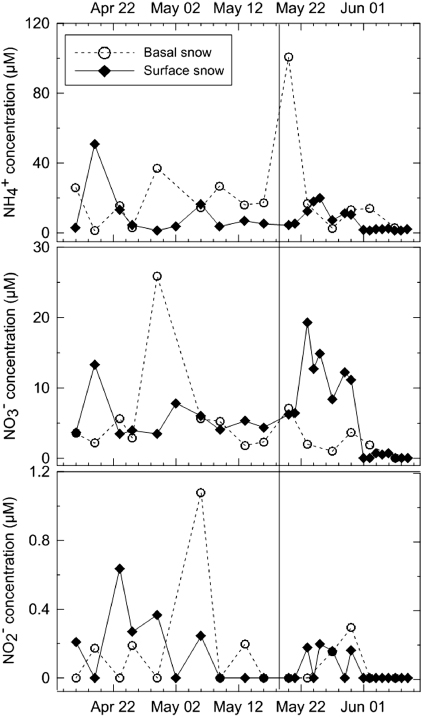
Figure 2. N chemical species concentrations (μmol l−1) throughout the field season. Surface concentrations are shown with diamonds while basal snow concentrations are circles. The black line represents the date that snowpack became isothermal.
Download figure:
Standard image High-resolution image4.2. Nitrogen fixation
Nitrogen fixation is a high energy process requiring 16 molecules of ATP to break the triple N bond. This process is carried out by only a few organisms including Cyanobacteria (e.g. Anabaena, Nostoc) and certain genera that form mutualistic associations with plants (e.g. Rhizobium) [37]. While we were able to detect phylogenetic probes that target genera capable of nitrogen fixation in most samples (SI table 1 available at stacks.iop.org/ERL/8/035004/mmedia), only a low number of reads associated to N2 fixation (about 2% of annotated reads) were detected in the pyrosequencing data set (table 1). This might be linked to the elevated NH4+ concentrations in the snow. Telling et al [38] also reported a lack of N2 fixation in cryoconite holes despite the presence of N2 fixing populations, which were attributed to high ammonium concentrations [38]. Ammonium, even at concentrations below 8 μmol l−1, has been shown to inhibit N2 fixation in some Cyanobacteria genera through the repression of nitrate reductase synthesis [39]. This falls well below the range of NH4+ concentrations observed in our snowpack (figure 2). In addition, microorganisms will preferentially use alternative forms of bioavailable N over N2 [40]. The anthropogenic N delivered by atmospheric transport appears to be preferentially metabolized, thus leading to a shift from N2 fixation to bioavailable N assimilation and metabolism. However, the genetic and taxonomic potential for N2 fixation is present in snow and this pathway may be initiated under the appropriate environmental conditions (i.e. low ammonium concentrations).
4.3. Ammonium assimilation: ammonification
Based on pyrosequencing results, almost half of the reads involved in N cycling were associated with ammonium assimilation (43.5%) and over a quarter (25.7%) with nitrate and nitrite ammonification (figure 1). The assimilatory process includes the conversion of nitrate to ammonia and starts with the reduction of nitrate to nitrite and then ammonium, which is used by the cell to incorporate nitrogen into biomolecules [41]. Reads corresponding to assimilatory nitrate reduction enzymes were detected in all but one sample (SI figure 1 available at stacks.iop.org/ERL/8/035004/mmedia), however, the enzymes involved varied across samples. For example, in samples dominated by eukaryotic and photosynthetic sequences (SVN35, SVN40), reads corresponding to EC 1.7.1.1 (plant nitrate reductases) and 1.7.1.3 (fungal nitrate reductases) were identified, while bacterial nitrate reductases (EC 1.7.7.2 and 1.7.99.4) were detected in all other samples. Once NO3− is converted to NO2−, nitrite can undergo either denitrification or ammonification to ammonium (figure 1). Based on the pyrosequencing results, reads associated with both plant/cyanobacterial (EC 1.7.7.1) and microbial (EC 1.7.1.4) nitrite reductases were identified in all samples (SI figure 1) and organisms able to carry out these reactions were observed using both microarray and pyrosequencing approaches. Assimilation appears to be a ubiquitous process in the snow, carried out by different phyla in all snow types.
4.4. Assimilation
Two ammonia/ammonium incorporation pathways have been identified in microorganisms: the NADP-dependent glutamate dehydrogenase (GDH) (EC 1.4.1.3), and the two-step energy dependent glutamine synthetase (GS) and NADP- (or NAD-)dependent glutamate synthase (GOGAT) (EC 6.3.1.2 and EC 1.4.1.13, respectively) [42]. Both pathways, which may be common to bacteria, cyanobacteria, algae, yeasts and fungi, lead to the net synthesis of one molecule of glutamate from one molecule of ammonia [43], while GS catalyzes the only pathway that leads to the formation of glutamine [44, 45]. Both these molecules constitute central nitrogen intermediates and provide N for the synthesis of all other N-containing components: ≈88% of cellular N comes from glutamate, and the rest comes from glutamine [46]. At low NH4+ concentrations, the GS-GOGAT pathway is essential for glutamate synthesis and for regulation of the glutamine pool, and is used when the cell is not under energy limitation [44, 45]. The GDH pathway is used in glutamate synthesis when the cell is limited for energy (and carbon; i.e. glucose-limited growth) but ammonium and phosphate are present in excess [44, 45]. Reads related to both pathways were identified in all samples and corresponded to enzymes from multiple phyla (SI figure 1). We also observed changes in the relative abundance of probes targeting efficient ammonium scavengers such as Caulobacter [47] that mirror those of ammonium concentrations at the base of the snowpack (figure 3). This co-variation may be due to a source effect rather than active microbial processes in the snowpack, however, most of the data presented in figure 3 represent sample points from the basal snow layer before the snowpack went isothermal. A thick ice layer was present throughout, making potential transfers from the soil to the base of the snowpack unlikely, but transfer from the surface of the snow is a possibility.
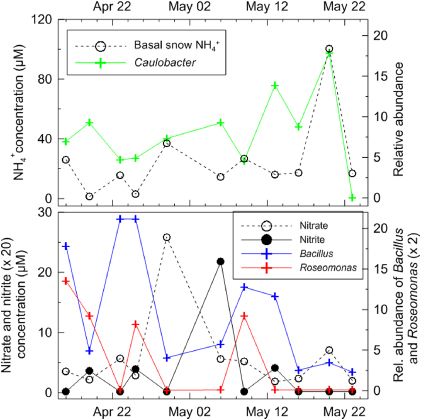
Figure 3. Relationship between nitrogen species and some microorganisms in the basal snow throughout the field season. The upper panel shows NH4+ concentrations (μmol l−1) and the relative abundance of Caulobacter (based on microarray hybridization intensity). The lower panel shows nitrate, nitrite concentrations (μmol l−1) and the relative abundance of Roseomonas and Bacillus (based on microarray hybridization intensity).
Download figure:
Standard image High-resolution image4.5. Nitrification
Nitrification is a two-step process carried out by a restricted number of autotrophic bacteria and Archaea. Although both steps are tightly coupled, each step is carried out by distinct microbial populations. The first step, carried out by organisms such as Nitrosomonas and Nitrospira (among others), is the oxidation of ammonium to nitrite, while the second involves the oxidation of nitrite to nitrate, which has been observed in Nitrobacter [37]. Both reactions are strictly aerobic and sensitive to acidic conditions. We were unable to detect probes that target any of the nitrifying genera in the microarray data (SI table 1) or any of the genes encoding the enzymes involved (ammonia monooxygenase, hydroxylamine oxidoreductase and nitrite oxidoreductase) in the pyrosequencing data set. This lack of nitrification evidence implies that it was not an important process in the snowpack at the time of sampling. This is consistent with reports by others who were unable to observe nitrification in the snowpack [48, 49], although Amoroso et al did propose two pathways for explaining the microbial isotopic signature observed in winter snow at Ny-Alesund: nitrification and denitrification [14]. If nitrification does occur in snowpacks, it might during another period of the year or it might not occur at any significant level due to anthropogenic inputs of nitrate and nitrite.
4.6. Denitrification
The complete denitrification of nitrate to N2 is catalyzed by separate nitrogen oxide reductases and generates nitrite, nitric oxide (NO), and nitrous oxide (N2O) intermediates [50, 51]. This process is facultative and expression is initiated in the cell by low oxygen tension and N oxide availability [50]. Reads associated to denitrification represented 7.2% of sequences assigned to N metabolism in our pyrosequencing data (figure 1). We detected genes encoding all the required enzyme complexes, but also probes that targeted genera whose members are able to carry out the denitrification reactions such as Roseomonas (figure 3), whose relative probe abundance was anti-correlated to nitrate concentrations and correlated to nitrite concentrations, suggesting that nitrate is being assimilated in order to produce nitrite. Similar patterns were observed for other known denitrifiers such as Bacillus [37]. Again, it is possible that this co-variance is linked simply to co-deposition or to a source effect (see discussion above for Caulobacter). As denitrification is carried out in environments with reduced oxygen concentrations, the snowpack likely contains some anaerobic microniches. We reported that the highest proportion of anaerobes was observed at the base of the snowpack [24]. Rohde and Price reported the existence of separate, isolated microenvironments within the same ice that explained the apparent concomitant aerobic and anaerobic metabolism [52]. Some dissimilatory ammonification from nitrate and nitrite has been observed in other environments under both aerobic and anaerobic conditions (e.g., Bradyrhizobium [53] and Bacillus [54]). The snow pack microbial community appears to be as rich in genes associated with this function as any other ecosystem analyzed (figure 4) based on comparative metagenomic analyzes described previously [30]. The combination of these observations and the significant deposition of nitrate and nitrite support the notion that the snowpack is actively transforming these compounds within the nitrogen cycle.

Figure 4. The relative abundances of next generation sequence reads associated with genes involved in N cycle transformations in different metagenomic datasets.
Download figure:
Standard image High-resolution imageWe were also able to detect genes involved in nitrosative stress response in our pyrosequencing data set (9.6% of N metabolism associated reads). The presence of these genes supports the hypothesis that microorganisms may be actively involved in denitrification, since nitric oxide (NO), a free radical, is a by-product of the denitrification process. NO is mutagenic, inhibits respiration, and can interact with a wide variety of cellular targets in eukaryotes and prokaryotes such as electron transport chains by binding metalloenzymes [50]. The NO produced during denitrification has been shown to be toxic to neighboring microorganisms in the environment and was suggested to influence the metabolic activity of microbial communities [55]. Upon NO exposure, a variety of genes that encode protective molecules can be induced [56]. In addition, biologically produced NO may be more effective in eliciting a stress response than other NO-generating compounds [55]. The presence of these genes suggests a functional response within the community to NO stress.
5. Conclusion
Based on our chemical, microbial and functional data set, all the required elements for microbially-mediated N cycling appear to be present in Arctic snowpacks and a simplified model of potential pathways is presented in figure 5. A major pathway is likely assimilation, which highlights the importance of N in these ecosystems. Based on metagenomic comparisons of different ecosystems [30], Arctic snow has among the highest amount of reads associated to nitrate and nitrite ammonification pathways, which suggests that N may be limiting (figure 4). It also appears that anthropogenic transport and deposition of bioavailable N species such as NH4+,NO3− and NO2− may contribute to altering N cycling in the snow, with no observed reads associated to nitrification and only a low percentage of reads corresponding to nitrogen fixation. Reads associated with denitrification and nitrosative stress were also amongst the highest in snow metagenomes. This work has clearly demonstrated the interest in determining the role of the snowpack microbial community in nitrogen cycling, a critical component of ecosystem functioning and climate change. Further work to elucidate which microorganisms are contributing to global N budgets and at what rates the transformations are being carried out at will include isotope measurements in addition to enzyme activity measurements.

Figure 5. Schematic N cycle in an Arctic snowpack. The width of the arrows represents the amount of reads associated with each process (genetic potential for each transformation). Ammonification includes both nitrate and nitrite processes.
Download figure:
Standard image High-resolution image
Acknowledgments
We are grateful to the Institut Paul-Emile Victor (IPEV, Program CHIMERPOL) for providing logistic support for the snow collection. AD thanks the Institut Universitaire de France. The authors would like to thank M De Angelis, S Cecillon and E Prestat for analytical assistance.