


Context of the Study
In Antarctica, blowing snow accounts for a major component of the surface mass balance (SMB) near the coast. It could remove >40% of the precipitation on the blue-ice area near the French base Dumont d’Urville (DDU; Reference Genthon, Lardeux and KrinnerGenthon and others, 2007), and therefore a better understanding of this process, especially on the Antarctic coast, is needed. Few numerical models take blowing/drifting snow into account. The Modèle Atmosphérique Régional (MAR) currently under development in the Laboratoire de Glaciologie et Géophysique de l’Environnement has a physical parameterization of the drifting snow (Reference Gallée, Guyomarc’h and BrunGallée and others, 2001). Measurements of precipitation (Reference Genthon, Krinner and CastebrunetGenthon and others, 2009) and blowing snow are scarce due to harsh conditions, principally very strong katabatic winds; therefore, collected data would make it possible to test numerical models of the SMB, such as the MAR, and of mass flux over the region. A better estimation of the SMB variations would improve the estimation of global sea-level variations under a changing climate. A present weather station (PWS), Biral VPF730, was set up on the coast at the Cap Prud’homme station, 5 km from DDU, to quantify precipitation. The blowing snow, according to the measurement principle, can be taken into account by the sensor, thus allowing the process to be measured.
VPF730 Measurement Principle
The VPF730 is both a visibility sensor and a present weather sensor: it performs automatic visibility precipitation analysis by detecting all atmospheric phenomena, including liquid and frozen precipitation (rain, drizzle, snow, snow pellets, snow grains, ice pellets and hail) and suspended particles, that lead to an obstruction of vision (mist, fog, haze, dust and smog). A temperature measurement is also included.
For determining visibility, the sensor uses forward-scatter meter technology to measure the amount of light scattered by small suspended particulates (i.e. fog, haze, and smoke aerosols) or larger particles (i.e. rain, snow, ice pellets, drizzle and mist) passing through the sample volume: the scattered infrared light from the source is received by two receivers (Fig. 1a). The sensor calculates the atmospheric extinction coefficient (EXCO). The sensor also measures the amplitude and the duration of the light pulse created by each hydrometeoric particle as it falls though the sample volume of 400 cm3 and in this way collects information on the size and velocity of the particle. A matrix with 16 bins of velocity classes ranging from 0.4 to 20ms–1 and 21 bins with size classes ranging from 0 to 3.2 mm equivalent radius, Ri, is generated.

Fig. 1. (a) Scattered near-infrared light of the transmitter received by the two receivers. (b) Particle recognition matrix with function of size and velocity.
The type of precipitation is established by one of two independent but complementary techniques. The first is based on the ratio of the backscatter atmospheric EXCO to the forward-scatter atmospheric EXCO. A ratio greater than a specific value indicates snow, whereas a ratio lower than a specific value indicates rain. The latter uses the size and velocity distributions of the precipitation particle. The particle-size/velocity distribution is characteristic of each type of precipitation. This recognition matrix is shown in Figure 1b and is called the precipitation recognition matrix.
Particles with a non-vertical movement will exhibit different speed and concentration than precipitation. Particles with distributions not indicative of rain or snow are not considered to be precipitation. To measure the intensity of the event, the number of particles in each size bin of the matrix is summed and multiplied by the equivalent volume of water and a calibration constant. For snow, a density factor is applied to obtain the equivalent water content. A water equivalent height (mm) is then determined.
Precipitation versus size/velocity matrix
The sensor is more or less a ‘black box’ for users and was designed for other uses than determining drifting snow. Therefore, the first test compares the precipitation and volume of particles estimated by the sensor during a drifting-or blowing-snow event using the size/velocity matrix:
where V is the volume of particles in the matrix, ni is the number of particles of a given size and Ri is the average particle radius of that given size.
The principle of measurement details cannot differentiate between vertically falling snow and particles blown horizontally by the wind: the sample volume is more or less a 400 cm3 cylinder, so particles can pass through the volume horizontally or vertically. Other types of PWS can make this differentiation, such as the Campbell PWS100 where the measurement principle is based on the diffraction made by particles on four horizontal laser planes. In the event presented in Figure 2, the VPF730 records precipitation. However, other types of reliable data (heating pluviometer, webcam images) do not reveal any precipitation. Thus, the blowing and drifting snow is interpreted by the VPF730 as precipitation.

Fig. 2. Precipitation recorded by the VPF730 without vertically falling snow.
In the size/velocity matrix, small particles with high velocity are considered as nonhydrometeoric particles. In some events, particles of blowing snow are detected as nonhydrometeoric particles (Fig. 3).

Fig. 3. Particles of one event considered as nonhydrometeoric by the size/velocity matrix.
The only particles in the atmosphere at the time were blowing-snow particles. Thus, the sensor could recognize blowing/drifting snow particles as nonhydrometeoric. The calculation process for determining the water equivalent height is not known, so the particle is considered to be nonhydrometeoric. This could lead to differences of variation between the water equivalent height and the volume per minute calculated by the matrix (Fig. 4). Consequently, the water equivalent height is not used in this survey. It is preferable to return to the raw data contained in the matrix and to calculate the volume per minute.

Fig. 4. Amount of precipitation water versus volume per minute calculated.
Experimental Field In the ALPS
Lac Blanc pass is located at the Alpe d’Huez ski resort near Grenoble, France. The large north–south-oriented pass, 2800 m high, consists of relatively flat terrain over a length of ~300m where blowing snow has been studied for several years. Although sensors for wind measurements may be reliable and accurate, this is still not the case for all blowing-snow sensors, and one of the goals of this site is to compare different blowing-snow sensors. Different drifting-snow sensors have been set up at Lac Blanc pass:
The FlowCapt consists of Teflon-coated tubes fitted with electroacoustic transducers. During snowdrift events, particles impact the tubes, inducing acoustical pressure within. This is picked up by the transducers. The signal is then filtered and amplified. The device is delivered with complete calibration, which is performed by using controlled flux of polyvinyl chloride particles. The sensor estimates the mass flux of snow (gm–2 s–1).
The snow particle counter (SPC-S7, Niigata Electric) is an optical device. The diameter and the number of blowing-snow particles are detected by their shadows on
photosensitive semiconductors. Electric pulse signals of snow particles passing through a sampling area are sent to an analyzing logger. In this way the SPC detects particles 20–250 μm in mean radius size, divides them into 32 classes, and records the particle number every 1 s. Assuming spherical snow particles, the horizontal snow mass flux, q, is calculated as:
where qd is the horizontal snow mass flux for the diameter d, n d is the number of drifting-snow particles, S is the sample area, t is the sample period and ρ p is the density of the drifting-snow particles (917 kgm–3).
Snow traps consist of butterfly nets, i.e. a metallic frame with a nylon bag attached. The mixture of air and snow grains goes through the traps, and while the snow is collected in the bag, the air escapes through the pores.
Intercomparison tests with FlowCapt, SPC and snow-net collectors have been carried out (Reference Cierco, Naaim-Bouvet and BellotCierco and others, 2007; Reference Naaim-Bouvet, Bellot and NaaimNaaim-Bouvet and others, 2010) at Lac Blanc pass. Briefly, it was shown (Reference Cierco, Naaim-Bouvet and BellotCierco and others, 2007) that (1) data stemming from FlowCapt are not sufficiently accurate and (2) SPC and snow traps show good agreement.
During winter 2010, the present weather sensor Biral VPF730 was set up beside the SPC at Lac Blanc pass, and data from the VPF730 and SPC were compared (Fig. 5).

Fig. 5. Test site in Lac Blanc path, Alpe d’Huez, France.
Intercomparison Between VPF730 and SPC
Calibration phase at 0.3 m height for a given drifting-snow event
The SPC and VPF730, set up at the same height, were compared during the winter of 2009/10. We first selected a snowdrift event (duration 3 hours 40 min) during which the flux varied within the widest possible range (0.4–2.6 g cm–2 min–1). The values given by the SPC are considered as the reference values.
The raw data are used to calculate an equivalent volume of particles over 5 min, which is compared with the SPC snow flux over 5 min (Fig. 6). The comparison is quantified by the A ratio, which represents the volume of particles measured by the Biral matrix (cm3 min–1) over the snow-flux output of the SPC (g cm–2 min–1).

Fig. 6. The dispersion of the A ratio is greater for smaller fluxes. (a) Flux recorded by the SPC. (b) Volume of particles passing through the sample volume per minute. (c) A ratio.
The correlation between the SPC output and the Biral volume is good, with a normal distribution centered on a mean value of 9.88 and a standard deviation of 3.02 over 213 samples. However, it must be pointed out that in this case the dispersion increases with decreasing values of snow fluxes.
One part of the A ratio dispersion obtained can be explained as the uncertainty created by the discretization of particle bins, which are larger for the VPF730 than for the SPC. The Biral device was initially designed to measure precipitation and not blowing snow, whose particles are <500 μm, less than the average radius of precipitation
particles. The uncertainty in the discretization of the particle bins is propagated by the Taylor series (Guide to the expression of uncertainty in measurement (GUM) method; ISO/IEC, 2008):
where U(Vi ) is the error on the i particle bin for the volume, and U(Ri ) is the error on the i particle bin for the radius.
The uncertainty in the A ratio is defined as the uncertainty of a uniform law with a q range:
The amount of this uncertainty can be seen for each A ratio as the dispersion around each point (Fig. 7). The uncertainty was determined on the A ratio average by

Fig. 7. The A ratio dispersion increases for the lower fluxes and cannot be explained by the uncertainty in the size bin.
where n is the number of samples.
The value of 0.002 compared to the A ratio standard deviation of 3.02 suggests that the dispersion of the A ratio for the small fluxes cannot be explained by the discretization of the size bins. Another source of uncertainty may be the height difference between the two sensors. As they are installed very close to the ground, a small height difference will lead to a noticeable difference in the flux. Another source may be the horizontal distance of 5 m between the two sensors on the test site.
If we consider the number and size of particles collected in the matrix, the VPF730 detects fewer and larger particles than the SPC. When several smaller particles pass through the sample volume, it sees them as one particle with a larger average radius. A ‘jump’ in the class size occurs. With an increase in the number of particles, the jump will be higher because more small particles will be counted as a larger particle. This phenomenon is shown in Figure 8 where an increase in the number of particles seen by the SPC corresponds to an increase in particle size in the VPF730, with fewer particles. Even with fewer particles, at the end of the event the particles are always larger than those detected by the SPC.

Fig. 8. (a) Jumps in the particle size seen by the VPF730 compared with (b) the particle size seen by the SPC.
The particle size in the matrix never corresponds to the real particle size. The VPF730 sees one larger particle when several smaller particles pass through the sample volume. This mechanism could explain one part of the standard deviation of the A ratio via the uncertainty in the volume, as the former calculation considers that the particles are in the correct bins. This error is integrated by the A ratio as it takes place during the calibration event. It should be pointed out that the A ratio should be used with caution for smaller flux since the standard deviation in the A ratio increased for smaller fluxes.
Calibration Tests
The calibration obtained was then tested for other drifting-snow events. The cumulative difference, D, since the beginning of the event (%) is studied in order to obtain the general error on events:
Two events were studied: the first occurred on 26 January 2010, the second on 1 February 2010. To have a common date reference with a difference in the acquisition frequency, a formula is applied for the date:
During these events, the flux determined by the lower FlowCapt, which is nearly the same height as the other two sensors, is shown in addition to the SPC and Biral fluxes (Fig. 9 and 10). There are differences between the results from the SPC and VPF730 even if the global variations of the two fluxes are similar. The first event has a small average flux, out of the calibration range, which is not the case for the second event with an average flux around 0.6 g cm–2 min–1. The cumulative differences show two different behaviors. For the first event, the cumulative error tends to be zero, whereas a systematic error was recorded for the second event. It must be pointed out that sensors are close to the snow surface (~30 cm): a small variation in height (e.g. due to sastrugi or ripples) can lead to a wide variation in snow fluxes.

Fig. 9. (a) Flux of the Biral (blue), of the SPC (red) and of the FlowCapt (green) during the 26 January event and (b) the cumulative difference.

Fig. 10. (a) Flux of the Biral (blue), the SPC (red) and the FlowCapt (green) during the 1 February event and (b) the cumulative difference.
During the first event, particles counted in the VPF30 matrixes were still larger and less numerous than expected because the present weather sensor cannot distinguish small particles when there are too many, as is the case when snow fluxes increase. This is shown in Figure 11 where the jumps in particle size recorded in the VPF730 matrix correspond to an increase in snow fluxes recorded by the SPC as well as to an increase in the number of particles. These jumps affect the difference between the fluxes. Nevertheless, overall the Biral with the new calibration responds well to the dynamics of the events.
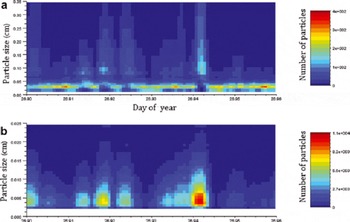
Fig. 11. (a) Particle size jump on the VPF730; (b) with an increase in the number of particles in the SPC.
The FlowCapt, which is especially designed for measuring blowing snow, has a more singular response than the new calibrated Biral, and an inferior cumulative difference. Thus the Biral with the new calibration (Equation (3)) can reproduce the blowing-snow flux dynamics well and can give a good idea of its value.
Drifting-Snow Data From Antarctica
VPF730 in Antarctica
The Biral VPF730 (Fig. 12) is located in East Antarctica, near DDU, at the summer camp Cap Prud’homme. It was initially designed to measure precipitation. Therefore, it was set up on the top of a container nearly 6m above the snow. However, with the current analysis made in the French Alps, we can now take a new look at the measures and the implication of the blowing snow.

Fig. 12. Biral VPF730 in Antarctica.
Data are analyzed based on the new calibration made. The size/velocity matrix is used to determine the volume per minute, as was done for the survey in the Alps (Equation (1)). To combine data over 1 year, the matrix counts the particles passing through the sample volume over the 5 min before every hour. The calculated flux therefore represents calculated value based on only 5 min of data every hour. The number of particles seen by the VPF730 over 1 hour is also available, even if these particles are not in the matrix. The matrix has the same variation with the number of particles seen in 1 hour. However, the linear regression between the two numbers of particles for several events is never the same, with a different dispersion due to the flux variability. The matrix is a good indicator of events and gives the general tendency of the flux but only accounts for the 5 min before every hour. With the volume per minute calculated from the matrix, the A factor determined by the new calibration is applied (Equation (3)); a flux in g cm–2 min–1 is then obtained.
VPF730 and Mellor’s formulation
Unlike at Lac Blanc pass, there are no other sensors capable of measuring blowing snow near the VPF730 at DDU. The flux calculated with the new calibration is compared with the blowing-snow flux formula determined by Reference Mellor and FellersMellor and Fellers (1986). This formula has been calculated over a set of >2000 usable Antarctic data that came mainly from Reference Mellor and RadokMellor and Radok (1960) and Reference Budd, Dingle, Radok and RubinBudd and others (1965). Anemometers and aerodynamic snow collectors were mounted in pairs on vertical masts in Antarctica with logarithmic vertical spacing. Data include measurements of new snow falling directly into the boundary layer and of particles only picked up from the surface. Multiple linear regressions were carried out in order to relate flux with the height and the wind speed while taking into account the relevant physics.
where Y = ln(q), X 1 = ln(z) and X 2=1/u 10, with q the flux (gm–2 s–1), z the height (m), and u 10 the wind speed at 10 m height (m s–1).
An anemometer installed 10m away from the VPF730 and at 10m height gives the wind speed used in the formula. Data are available online from the GLACIOCLIM SurfAce Mass Balance of Antarctica (GLACIOCLIM-SAMBA) observatory (http://www-lgge.ujf-grenoble.fr/ServiceObs/SiteWebAntarc/AWS.html). This is the half-hour mean; the data used are those from half past the hour to the hour, but a difference still exists between the matrix (5 min mean) and the wind speed (half-hour mean). However, the wind responsible for the snowdrift is a katabatic wind characterized by a constant speed and direction, so the half-hour wind-speed mean should be close to the 5 min wind-speed mean, but a difference can exist, and thus also an error between Mellor’s flux and the matrix flux.
The 30 October 2009 event was studied. During this event, the number of particles was consequential, up to 3700 particles seen in 5 min, associated with a strong katabatic wind with a wide range in speed from 18 to 31 ms–1 at 10 m height. The phenomenon seen in the Alps was also observed here: as the number of particles seen increased, a jump in the particle size was detected and as soon as the number decreased, so did the particle size (Fig. 13). The flux calculated from the Biral is within the calibration range. The particle size in Antarctica cannot be determined otherwise; we assume that the behavior of the VPF730 is the same as in the Alps, so the particle size cannot be used.

Fig. 13. Jump in the particle size during the 30 October 2009 event.
The flux calculated by the matrix is almost the same as the variation calculated by Reference Mellor and FellersMellor and Fellers (1986) (Fig. 14). The flux is of an acceptable value (~1 g cm–2 min–1) compared with the A ratio dispersion seen in the calibration test. The differences in flux values are on the same order of magnitude as the Biral and the SPC. The new calibration seems to be as accurate as in the Alps for this flux value.

Fig. 14. Fluxes during the 30 October 2009 event (a), with the associated wind speed at a 10m height (b).
Perspectives
In the 18 January 2010 event, the number of particles was lower: up to 4000 particles were seen in 5 min, but otherwise no more than 2000 particles were seen, associated with a moderate katabatic wind with a range in speed from 11 to 21ms–1 at 10m height (Fig. 15).

Fig. 15. Same as Figure 14, for the 18 January 2010 event.
The fluxes were smaller than for the previous event, as the wind speed was less important and was not in the calibration range made in the Alps, and the dispersion of the A ratio was very scattered for such a small flux (~0.1 g cm–2 min–1). The differences between the two fluxes were greater without the same variations, in contrast to all the other events. The on-site personnel noted three precipitation falls: 5, 10 and 16 hours after the beginning of the event. Precipitations increased the flux after a given height (Reference TakahashiTakahashi, 1985), due to an augmentation of particle concentration in height not related to the wind speed. As the PWS is set up at 6 m height, the precipitation impact in small fluxes should be considerable, and better knowledge of this process is needed in order to estimate the blowing-snow flux with the VPF730.
Conclusions
In this study, we identified the impact of drifting snow on the present weather sensor, the Biral VPF730, and we propose a calibration for quantifying particle flux.
The calculated precipitation is not representative of drifting-snow flux, because the software rejected some drifting-snow particles considered as nonhydrometeoric in the calculation of precipitation. This consideration is due to the different size/velocity signature of the drifting-snow flux than the precipitation signatures for which the present weather sensor has been designed. We thus had to return to the raw data contained in the size/velocity matrix.
The physics of the drifting-snow process is not well reproduced: particles are larger and less numerous than expected. Nevertheless, the Biral VPF730, with the calibration obtained, yields better results than the FlowCapt sensor, which was designed for estimating snow fluxes.
The calibration has been tested on more drifting-snow events than those shown in this survey. Only the more interesting ones have been exploited with regard to the measurement bias. However, it is necessary to test the validity and accuracy of the calibration under different conditions, such as a height above 1 m, wind speed larger than 3 ms–1 and different fluxes.
Thus, data from Antarctica could be reviewed in order to estimate drifting-snow fluxes in the past few years. The new calibration seems to be as accurate as in the Alps for fluxes over 1 g cm–2 min–1. The effect of precipitation on the flux has to be investigated, as this variation has a strong impact on the data.
Acknowledgements
We acknowledge the French Polar Institute (IPEV), the CALVA program and the GLACIOCLIM-SAMBA observatory. This work was supported by funding to the ice2sea program from the European Union 7th Framework Programme, grant No. 226375. This is ice2sea contribution No. 016. We thank F. Marine, X. Ravanat and F. Ousset for their help in the field in the Alps.


