


1. Introduction
In the early days of alpinism at the end of the 18th century, activity was intimately associated with scientific exploration. De Saussure performed barometric measurements at the summit of Mont Blanc, France, in 1786, as well as extensive observations of the nature of glaciers (de Saussure, 1779–96). This helped to overcome the fear previously associated with high altitudes and with glaciers. Today, glacier structure, dynamics and evolution are better understood. This understanding helps to guarantee the security of alpinists and is generally included as a part of mountain guide education and training.
Until the 1970s, ice and snow climbing was largely restricted to the summer season on glaciers and perennial snow/ice couloirs or gullies, i.e. on ice formed essentially from the densification of snow. In the early 1970s, some climbers, particularly in North America, started to climb in winter on ephemeral ice structures formed from the freezing of liquid water seeping on steep rock, i.e. on waterfall ice. This activity appeared a few years later in the Alps and developed rapidly in the 1980s–90s. Nowadays, waterfall ice climbing is a fully developed winter alpine activity: in France the number of ice climbers, regular or occasional, can be roughly estimated from the number of ice axes sold, ∼10 000. Ice climbing can be a risky activity as a result of the climbers’ inaptitude, lack of experience or misjudgement (subjective risks), or due to natural hazards such as snow avalanches, ice-block falls, or collapse of the waterfall structure (objective risks). This is not an anecdotal problem: for example, in France from 2000 to 2006, ice-climbing accidents led to 148 rescue interventions, 47 severe injuries and 22 deaths. Among these, subjective risks were the main cause, but ice-block falls and collapse of the structure caused 14% and 5.5% of the accidents respectively.
To our knowledge, with the exception of one internal report (Reference BianchiBianchi, 2004), there is no scientific study of waterfall ice in the literature. Beginning in the 2006/07 winter, we have performed a case study of waterfall ice formation, structure, evolution and mechanical stability. Our subject is a famous ice-climbing site near the icefall of Glacier d’Argentière, in the Mont Blanc massif. In this paper, we focus on ice formation, internal microstructure and evolution with weather conditions: How fast does a frozen waterfall form in relation to air temperature? What can we learn about the growth mechanism from an analysis of ice microstructure? Does this mechanism depend on the orientation of the waterfall, on its steepness? At this stage, our goal is of a fundamental nature rather than to evaluate objective risks, even less to build a scale of risk in a way similar to that developed for snow avalanches (Reference AnceyAncey, 1996). However, we hope that the observations reported here, when properly summarized for a non-scientific audience, will ultimately help climbers and professional guides to improve their evaluation of field conditions.
As the literature on this subject is nearly non-existent, our aim is to provide initial observations and analyses that could serve as a basis for future work.
2. Situation
Fieldwork and observations were performed during the boreal winters of 2006/07, 2007/08 and 2008/09, on three different frozen waterfalls situated on the left and right sides of Glacier d’Argentière below the icefall (45°58′ N; 6°58′ E) at ∼2100 m a.s.l. (top of the climbs) (Fig. 1). This altitude is rather high for waterfall ice climbs in the Alps. Frozen waterfalls form every year, during a relatively long period approximately from early December to March or April.

Fig. 1. Summer satellite image of the Argentière frozen waterfall area (45°58′ N, 6°58′ E). Image © 2009 Institut Géographique National, France.
The main subject of our study, where most of the observations and ice sampling were performed, is Nuit Blanche, a very steep frozen waterfall, graded 6 on a scale of 7 in climbing difficulty and first climbed in January 1994 (Reference Damilano and PerrouxDamilano and Perroux, 1998). It is about 120 m long and the top two-thirds is nearly vertical (Fig. 2). It is oriented north-northeast and remains in shade for nearly all the winter. The water flow feeding Nuit Blanche is mainly artificial, emanating from the galleries of the Emosson Dam at a regular rate throughout the season. In this study, we focus on the top of Nuit Blanche, consisting, in most years, of a 16.5 ± 1 m high vertical ice pillar, generally separated from the rock cliff between its extremities, a situation known as ‘free-standing’ by the international ice-climbing community (Fig. 3). Nuit Blanche’s configuration is supposed to be representative of similar steep ice climbs. Free-standing ice climbs are challenging, owing to a higher risk of mechanical collapse than in other vertical ice structures such as stalactites (free at the bottom) or ice ‘columns’ anchored to the cliff (Fig. 3).
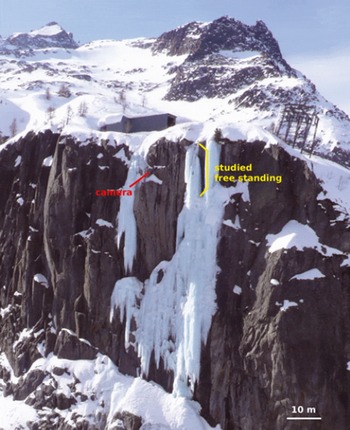
Fig. 2. Overall view of the Nuit Blanche frozen waterfall. Cameras view the top free-standing section, where sampling and pressure measurements were performed.

Fig. 3. Sketch of (a) a stalactite, (b) a free-standing and (c) a column section of a frozen waterfall.
Less frequent observations were also performed on two other frozen waterfalls situated on the other side of the glacier canyon: Shiva Lingam (orientation west, length 120 m, graded 6) consisting of an impressive vertical freestanding section of 35 ± 1 m at the top, and Le Grand Bleu (orientation southwest, length 100 m, graded 4+), a wide, less steep (∼75–80°) wall of ice anchored to the cliff (Reference Damilano and PerrouxDamilano and Perroux, 1998) (Fig. 4). Owing to their orientation, these two frozen waterfalls are affected by the sun for part of the afternoon, even in December. This differs strongly from the situation at Nuit Blanche, and is expected to affect the frozen waterfall evolution during the season (see below). The water flow feeding these frozen waterfalls is entirely natural, i.e. more dependent on precipitation and temperature conditions (snowmelting).

Fig. 4. View of the right bank of the free-standing section of the Nuit Blanche frozen waterfall.
These three frozen waterfalls are representative of high-level ice climbing, owing to their verticality and the objective risks associated with the free-standing configuration of Nuit Blanche and Shiva Lingam.
3. Experimental Protocol and Observations Performed
Various instruments, observations and samplings were utilized to study the formation and evolution of the frozen waterfalls at both the macro- and microstructural scale, and to relate the structure to meteorological conditions, waterfall typology and possible other factors.
To follow the local meteorological conditions, we used data recorded by a meteorological station installed within the framework of the GLACIOCLIM project (http://www-lgge.obs.ujf-grenoble.fr/ServiceObs/index.html) at 2400 m a.s.l., on the moraine on the right-hand side of the glacier just above the serac fall (Fig. 1). This station measures, with a 30 min periodicity, air temperature at 4.15 m above ground, humidity, wind speed and direction, as well as incident short- and longwave radiation. We focused here essentially on air temperature, which has been corrected by a temperature/elevation gradient of 0.6°C (100 m)−1 to obtain temperature at 2100 m a.s.l. (top of the waterfalls).
During the 2007/08 and 2008/09 winters, two internal sensors were installed within the free-standing section of Nuit Blanche, one at the top of the ice column, the other 1 m from the bottom. These sensors measured internal pressure data which will be discussed elsewhere. They also recorded the temperature within the ice, with a 10 min periodicity. At the date of installation of the sensors, the ice temperature was recorded at a horizontal distance of a few centimetres from the surface, but this distance increased during the season as the sensors were covered by newly grown ice, up to ∼50 cm.
Ice was regularly (about every 2 weeks) sampled along the length and at the bottom of the free-standing section of Nuit Blanche. Two types of samples were taken, individual stalactites hanging parallel to the length of the free-standing section, and horizontal 600 mm ice cores (diameter 70 mm). These ice cores were sampled using a new portable drilling system (Fig. 5) developed at Laboratoire de Glaciologie et Géophysique de l’Environnement. Ice cores were also sampled at different levels along the Grand Bleu wall, as the mechanism of ice formation along this non-vertical wall is expected to be different. From all ice samples, we cut thin sections and measured ice microstructure (grain size and shape) and associated fabrics using an automatic ice-texture analyser (AITA; Reference Russell-Head and WilsonRussell-Head and Wilson, 2001) (section 4.3).

Fig. 5. Coring in the Nuit Blanche free-standing section.
To follow the global evolution of the frozen waterfalls throughout the freezing season, digital cameras were installed to take pictures at regular intervals (six photographs per day, with a periodicity of 90 min, starting from 0830 h local time). One camera was installed on the right side of the free-standing section of Nuit Blanche, at a distance of about 10 m (Fig. 2). Another camera was installed on the other side of the glacier canyon, in front of Shiva Lingam. From the successive images, a simple image analysis procedure was used to estimate the area occupied by the frozen waterfalls within the camera’s field; this was used as a two-dimensional (2-D) proxy of the size of the frozen waterfall. This proxy was calculated from the 1300 h image each day (when available). For Nuit Blanche, the camera’s field covered the top of the free-standing section, as seen from the side (Fig. 6). For Shiva Lingam, the camera focused on the top half, including the 35 m freestanding section (Fig. 7). In his study, Reference BianchiBianchi (2004) used a similar procedure to follow the evolution of the frozen waterfall Degli Specchi, Chiesa Valmalenco, Italy, during the winters of 2000/01 and 2001/02, although at a much reduced and irregular sampling rate, averaging one photograph per 5 days.

Fig. 6. Evolution of the Nuit Blanche free-standing section, automatically recorded by the camera (sample). From left to right: 28 November 2007, 17 December 2007 and 1 January 2008. The green curve indicates the contour selected for the area measurement. The horizontal borders were kept fixed (red horizontal lines).

Fig. 7. Evolution of the Shiva Lingam free-standing section, automatically recorded by the camera (sample). From left to right: 24 November 2008, 10 January 2009 and 9 March 2009. The climber in the middle image gives the scale. The green curve indicates the contour selected for the area measurement. The horizontal borders were kept fixed (red horizontal lines). A large horizontal crack is clearly visible at the top of the free-standing section in the right image.
4. Observations and Results
4.1. Meteorological conditions
We focus here on the local meteorological conditions as recorded by the Argentière AWS during the winters of 2007/08 and 2008/09. As the photographic survey of the waterfalls during winter 2006/07 was limited to the very end of the season, we do not focus on that season.
Figure 8 compares the air temperature for the two seasons, from late November to early May. Winter 2007/08 was milder than 2008/09, with several episodes of positive air temperature, including a marked episode between 19 and 30 January (day numbers 384–395 in Fig. 8) that had an impact on the stability of Shiva Lingam (see below). In this respect, the 2007/08 winter was representative of the winters of the past two decades. In contrast, the 2008/09 winter was significantly colder, without warm episodes except for a short period from 20 to 24 December (day numbers 354–358 in Fig. 8). This resulted in a better than average ice-climbing season, and higher waterfall ice volumes (see below). This difference between the two winters is exemplified when plotting the freezing potential,

from a start date t 0 (30 November, day number 334 in Fig. 8), where T f is the freezing point of water and T(t) the air-temperature record. With this definition, negative temperatures give rise to positive freezing potential. Compared with the classical freezing degree-day parameter (Reference Maykut and UntersteinerMaykut, 1986), the freezing potential, FP, takes into account positive temperatures in order to discuss possible melting of the frozen waterfalls during the season. After 1 January, the freezing potential stabilizes in winter 2007/08 for more than 2 months, before it increases again until mid-April. In 2008/09, however, it continues to rise significantly throughout the season. At the first order, we assume the freezing potential is the main factor influencing the frozen waterfall growth.

Fig. 8. Evolution of air-temperature conditions at the Argentière frozen waterfall area throughout the two winters considered: 2007/08 (red) and 2008/09 (blue). The thin curves show the evolution of the average daily temperature. The thick curves represent the freezing potential, FP, over the winter.
In terms of precipitation (either rain or snow, measured at the Chamonix weather station and expressed in mmw.e.) the two winters were similar, with cumulated precipitation over the period 1 November–1 April (day numbers 305–486) of 402.8 mm w.e. in 2007/08 and 386.8 mm in 2008/09.
4.2. Global evolution
From the cameras installed in front of Shiva Lingam and on the side of the Nuit Blanche free-standing section, we reconstructed the large-scale evolution of these structures during the 2007/08 and 2008/09 winters. For technical reasons (e.g. frost, snow), data are not available for the entire winter. The evolutions of the 2-D proxies of the frozen waterfall size were compared with meteorological data provided by the Argentière automatic weather station (AWS). As the cameras were not fixed at exactly the same place in 2007/08 and 2008/09, quantitative comparisons of these size proxies between the two winters are difficult. However, since conditions in 2008/09 were more favourable (see above), frozen waterfalls that winter were much larger than in the previous winter, and the upper part of Nuit Blanche was fixed to the rock face, i.e. it was no longer a free-standing structure, but an ice column (Fig. 3).
For vertical ice structures such as the free-standing sections of Nuit Blanche and Shiva Lingam, the initial stage of formation of the frozen waterfall consists of stalactite growth from the top and, to a lesser extent, the formation of a conical stalagmite at the bottom (Figs 6 and 7). Stalactites lengthen rapidly and then assemble to form an ice pillar. During this initial stage of formation, water flows (and freezes) at the surface of the structure, the waterfall ice volume is closely linked to the freezing potential (see below) and it grows rapidly in favourable conditions (Figs 9 and 10). In other words, the waterfall is highly sensitive to temperature fluctuations. This stage lasts on average about 1 month. Then the ice volume increase follows an asymptotic behaviour, and essentially does not increase even if the freezing potential continues to rise. A similar evolution was reported by Reference BianchiBianchi (2004). This behaviour is unlikely to be the result of a decrease of the water flow at the top of the waterfalls, as (1) it is also observed for Nuit Blanche which is fed artificially at a regular rate throughout the season and (2) owing to the orientation (west) of Shiva Lingam, the average water flow at its top is expected to increase throughout the season, with increasing sunshine duration and snowmelt.

Fig. 9. Global evolution of the Nuit Blanche free-standing section: (a) 2007/08, (b) 2008/09. Blue thick curve: normalized waterfall area as seen from the camera (Fig. 5), a proxy of the ice structure size. Red thin curve: evolution of air temperature. Black thin curve: evolution of the ice temperature inside the structure. Magenta thick curve: freezing potential.

Fig. 10. Global evolution of Shiva Lingam: (a) 2007/08, (b) 2008/09. Blue thick curve: normalized waterfall area as seen from the camera (Fig. 6), a proxy of the ice structure size. Red thin curve: evolution of air temperature. Magenta thick curve: freezing potential.
As the free-standing section enlarges and thickens, the water circulates primarily between the ice and the rock face and/or inside the structure. The water becomes more and more isolated from the outside air as the frozen waterfall grows, and we believe that the insulating character of the ice is strong enough to explain the asymptotic volume increase. As shown below, we have evidence from the ice microstructures for relatively constant, close to 0°C, ice temperatures in the core of the ice pillar. In Figure 9, the comparison between the weather-station temperature record and the in situ temperature sensor record shows that the air-temperature fluctuations are strongly attenuated inside the ice. During this asymptotic stage, the surface of the ice structure is essentially dry whereas water circulates inside.
To further test this scenario, we propose the following crude model of waterfall ice growth, inspired by similar models of sea-ice growth (e.g. Reference Maykut and UntersteinerMaykut, 1986). We consider that the waterfall ice structure consists of an ice layer of thickness h and heat conductivity k insulating the water circulating between the ice and the rock face, or inside the ice structure, from the outside air (Fig. 11). The temperature at the ice/water interface is at the freezing point of water, T f, while the temperature at the outer surface follows the air temperature T. This last point constitutes a first approximation of this model, especially when h is small. We assume a linear temperature gradient within the ice, and Equation (1) defines the conductive heat flux, F c, knowing that F c(x = 0) = F c(x = h):
The growth (or melt) rate of the ice layer is then determined from the energy balance:
where ρ i is the ice density, L w is the specific latent heat of fusion for water and F w is the water heat flux. If the right-hand side of Equation (2) is negative, i.e. if a negative conductive heat flux induced by negative air temperatures overcomes the heat flux carried by the water, the waterfall ice structure grows, whereas a positive sum implies ice melting.

Fig. 11. Schematic illustration of a simple waterfall ice-growth model (details in text).
Assuming further a negligible water heat flux (F w ≈ 0) as well as h(t = t 0) = 0 allows an analytical integration of Equation (2):

If the freezing potential increases roughly linearly with time, such as in 2008/09 (Fig. 8), then h(t) ∼ t 1/2, i.e. the growth rate decreases with time but never vanishes, in contradiction with our observations (Fig. 10) and stressing the role of the water heat flux F w.
A quantitative prediction of the waterfall ice evolution from Equation (2) is illusory, because F w is unknown and because this simple model is based on crude approximations of the geometry of the problem or of the outer surface temperature. However, we can test whether the measured evolutions of our waterfall size proxy, assumed to be proportional to ice thickness h (which is another crude simplification), are compatible with a growth (or melting) rate of the form (A/h)(T f − T) − B (extrapolated from Equations (1) and (2)), where A and B are positive constants. This is done for Shiva Lingam (for which the global evolution of the waterfall ice structure is best measured) in Figure 12, which shows that such a relation correctly describes the initial, rapid stage of formation, as well as the asymptotic behaviour. This asymptotic behaviour is attained when B counterbalances (A/h)(T f − T), i.e. when a diminishing conductive heat flux (as the result of increasing isolation) is counterbalanced by the water heat flux, F w. It is also clear from Figure 12 that this purely thermodynamic model is unable to reproduce drastic collapses of the structures, or secondary growth episodes that may occur during the asymptotic period in relation to brief but severe cooling. Clear examples are observed for Nuit Blanche around 11 February 2009 (day number 407) and for Shiva Lingam after 6 January 2009 (day number 371). Field observations revealed that these episodes were associated with water again flowing outside the structure. We suggest that thermal fracturing within the ice pillars, creating new paths for the water, might trigger these episodes, which are however not systematically observed (e.g. Shiva Lingam on 11 February 2009, day number 407).

Fig. 12. Global evolution of Shiva Lingam from a simple thermodynamic model: (a) 2007/08, (b) 2008/09. Blue full curve: normalized waterfall size as seen from the camera. Red dashed curve: evolution of this waterfall size proxy as modelled by a growth (or melting) rate of the form (A/h)(T f − T) − B, where A = 4 and B = 0.18 for 2007/08, and A = 11 and B = 0.66 for 2008/09.
Whereas the volume of ice throughout the season depends on the temperature conditions and, particularly, the evolution of the freezing potential, the withering of these free-standing structures does not occur by progressive melting. Instead, they can collapse abruptly after the propagation of large fractures at their tops (e.g. Fig. 7). These fractures are initiated by thermal stresses resulting from strong and rapid temperature variations. In this respect, relatively mild but stable air temperatures are not particularly critical, whereas rapid cooling is much more dangerous. As an example, in 2007/08, Shiva Lingam collapsed suddenly during a rapid cooling by >10°C following a warm episode (Fig. 10). Such a catastrophic collapse was prevented at Nuit Blanche by its larger dimensions at the bottom, although a large crack did appear across the top of the ice column (not visible in the camera field). The mechanical stability of these frozen waterfall structures will be discussed elsewhere.
4.3. Microstructures and fabrics
Ice is a crystalline material with a hexagonal crystallographic structure. The orientation of a single crystal of ice (also called ‘grain’ in a polycrystalline microstructure) is defined by the orientation of the long axis of the hexagon, the c axis (Reference Owston and LonsdaleOwston and Lonsdale, 1948). The microstructure represents the shape and size of the grains in a polycrystalline sample, whereas the fabric is a measure of the orientation density of the c axes for all the grains of the sample. Microstructure and fabric development in natural ice are closely linked to the solidification mechanisms or the deformation and recrystallization history of the ice structure or sample (Reference Petrenko and WhitworthPetrenko and Whitworth, 1999). We distinguish solidification (or crystallization) mechanisms that correspond to the ice formation from liquid water, from recrystallization mechanisms that are microstructure evolutions in the solid state (grain growth, nucleation of new grains, etc.). Microstructures and fabrics are observed from thin sections of ice samples under polarized light. This technique reveals grain sizes and shapes, and allows us to measure the c-axis orientation of grains using an AITA (Reference Russell-Head and WilsonRussell-Head and Wilson, 2001).
As noted in section 4.2, free-standing frozen waterfall structures seem to form initially from an assemblage of stalactites, but the internal structure and microstructure is expected to evolve throughout the winter, in relation to temperature conditions. To analyse this formation and the evolution of the frozen waterfall, we sampled individual stalactites, as well as ice cores within the bulk of the freestanding sections. For comparison purposes, we also analysed ice cores extracted from frozen waterfalls whose structure is a non-vertical ice layer anchored to the rock-face (e.g. Le Grand Bleu).
4.3.1. Stalactites
Reference LliboutryLliboutry (1964) reported some observations of ice stalactites, which he also called ‘exudation ice’. He reported microstructures characterized by small, homometric grains in the centre and large, radially elongated grains at the periphery. Microstructure observations on calcite stalactites (speleothems) reveal a very similar geometry, with columnar grains in which the crystal orientation is commonly perpendicular to the growth surface of the speleothem (Reference Frisia, Borsato, Fairchild and McDermottFrisia and others, 2000). Frisia and others noted that speleothems consisting of columnar microstructures are always wet, with a constant degree of supersaturation.
The 25 stalactites analysed in our study (50–100 mm diameter) were almost always characterized by the remarkable microstructure visible in Figure 13, with a long vertical central grain surrounded by horizontal elongated grains (although, depending on the location of the sectioning in the vertical plane, this central grain did not always appear in the thin section). As also noted by Reference LliboutryLliboutry (1964), we observed air bubbles trapped at the periphery of the stalactite during freezing episodes (Fig. 14). This suggests that stalactite growth is intermittent. The size of the central vertical grain must depend on the temperature history during its growth. Transitions with very small grains are observed, which correspond to fast nucleation of new grains due to rapid transition to cold temperatures. Figure 15 represents three thin sections of stalactites taken along the free-standing section of Nuit Blanche on the same day. This figure indicates the large diversity of microstructures that are formed in similar conditions, although the general organization described above remains.

Fig. 13. Two thin sections of the bottom part of a stalactite extracted from the Nuit Blanche free-standing section, observed through polarized light. (a) Vertical section; the arrow indicates the vertical direction. (b) Horizontal section; the dashed line indicates approximately the location of the vertical section.

Fig. 14. Horizontal section of a stalactite, observed (a) through polarized light, and (b) in regular light to highlight trapped bubbles.

Fig. 15. Vertical thin sections from three stalactites sampled on the same day, observed through crossed polarized light. The arrows indicate the vertical direction.
Figure 16 shows the c-axis orientation data provided by the AITA from three thin sections cut vertically along a stalactite. The microstructure on the left is colour-related to grain c-axis orientation (defined by two angles, azimuth and colatitude). In the pole figure (right), dots are the projections of c-axis orientations taken every 500 pixels over the sample (one pixel ∼ 40 μm). Full lines limit equidensity areas, showing orientations of highest c-axis concentration. The pole figures show two orientation ‘modes’, one with a highly concentrated density of c axes aligned along the horizontal x direction, the other with c axes gathered in a vertical plane, parallel to the y direction. These two modes are associated with the central large grains and the lateral elongated grains respectively. Orientation data from horizontal sections along the stalactites reveal c axes isotropically distributed in the vertical plane (not shown here). When grains are smaller, similar though more scattered fabrics are observed.

Fig. 16. Vertical thin sections analysed using an AITA. On the left, the polarized light exhibits colours associated with c-axis orientation values. On the right, pole figures provide the statistical distribution of the c axes. Each dot is the projection in the figure plane of one c axis (from one pixel of the picture; data are plotted every 500 pixels). The pole figures clearly show two distributions: one in the horizontal direction (spot on the x axis, close to 90°) which corresponds to the orientations of the vertically elongated central grains, the other along the vertical direction (girdle along the y axis) which corresponds to the orientations of the horizontally elongated grains.
In the laboratory, as ice crystals slowly crystallize from liquid water, the grains with c axes oriented in a plane perpendicular to the growth direction grow faster, and dominate the final microstructure (Reference Michel and RamseierMichel and Ramseier, 1971). Our fabric measurements indicate that the central grain grows vertically, from the water flowing on the outside surface all the way to the tip of the stalactite, with the freezing at the tip causing the elongation of this central crystal. The columnar grains grow horizontally from small nuclei which form on the surface of the central grain during rapid cooling. Their growth follows the temperature gradient, similar to the growth of lake ice, which is also characterized by columnar grains (Reference Michel and RamseierMichel and Ramseier, 1971). The column-shape structures reveal crystallization with no deformation constraint. The measured fabrics are typical of ice growth mechanisms and show no sign of the impact of deformation processes on the microstructure.
4.3.2. Ice cores
Ice cores 600 mm long were drilled along the Nuit Blanche free-standing section, and in the Grand Bleu frozen waterfall whose structure is an ice layer anchored to rock. A large variety of microstructures were observed within these cores (Fig. 17). The c-axis orientations were measured as described for the stalactite (Fig. 18). Observations are qualitative, but some reproducible features can be identified, as they are observed on more than half the samples:
grain size can vary from very small (mm scale) to relatively large (cm scale) within the same core
the transition between large and small grain microstructures is generally very sharp
small grain microstructures are associated with high bubble density
large grain microstructures are transparent, essentially bubble-free
large grains are mostly elongated, with c axes primarily oriented in a plane perpendicular to the elongation direction (Fig. 18)
at the interface with water, in the centre of the freestanding section, grains are very large.
in most of the cores sampled in the free-standing section, we found the stalactite microstructure (Figs 17a and 18).

Fig. 17. Thin sections from a long ice core extracted from (a) the Nuit Blanche free-standing section, and (b) the Grand Bleu frozen waterfall. For Nuit Blanche, the full core is sketched (yellow) on the left, together with some stalactite boundaries.

Fig. 18. Orientation data from parts of deep ice cores extracted along the Nuit Blanche free-standing section. (a) Four contiguous thin sections showing large elongated grains with c axes oriented in planes perpendicular to the column directions (alignment of spots). The main column direction is indicated by the green lines. The plane where c axes are aligned is represented by the red lines. (b) Part of a long core with a recognizable section of a stalactite microstructure. The small grains induce a random orientation while a few horizontal elongated grain orientations dominate (red spot). The upper sketches represent the orientation of the cores within the vertical waterfall structure.
From these observations, the following assumptions concerning the crystallization history can be inferred. (1) The microstructure reflects the temperature changes during crystallization. Indeed, grains that formed slowly with mild and stable temperature conditions are large and bubble-free, while grains that formed rapidly due to rapid cooling are small and surrounded by bubbles as the freezing front is attained too quickly for gas to escape. (2) The microstructure does not evolve with time (i.e. there is no grain boundary migration due to a reduction of the grain boundary energy, meaning that there is no significant normal grain growth). We see this by keeping track of the stalactite microstructure and noting that small grains remain visible along the full core length. (3) As observed in the stalactites, large elongated grains grow in the direction of the temperature gradient. Their c axes are primarily oriented perpendicular to this direction (Fig. 18). The resulting ice is very transparent.
Deformation and recrystallization mechanisms are known to strongly impact microstructure and fabrics (Reference DuvalDuval, 1979; Reference De la Chapelle, Castelnau, Lipenkov and Duvalde la Chapelle and others, 1998). The measurements performed along the Nuit Blanche free-standing section ice cores reveal microstructures and fabrics typical of crystallization mechanisms driven by temperature gradient. However, grain-size increase could be driven by a reduction in grain boundary energy. This normal grain growth, associated with a migration rate of 10−7 m2 a−1 at an average temperature of −2°C (Reference Jacka and LiJacka and Li, 1994) would induce a grain-size increase of about 0.1 μm for an initially 10 mm diameter grain size during the 3 months of the winter season, i.e. it is negligible over the timescale considered
Along the ice cores drilled in Le Grand Bleu, similar characteristics were observed. Clusters of very small grains surrounded by high bubble density (Fig. 17b) must come from snow layers adhering to the ice surface when the ice surface is wet. This is made possible by the relatively low inclination of the frozen waterfall (∼75–80°).
5. Conclusions
For the first time, we have analysed the formation and evolution, from the global volume to the local microstructure, of frozen waterfalls throughout the winter. This evolution can be summarized as follows. For vertical freestanding structures:
-
1. The free-standing structures within frozen waterfalls are observed to grow rapidly at first, from the aggregation of stalactites forming along a non-channelled water flow. The stalactite microstructures reveal the temperature conditions during their crystallization, with alternation between small grains trapping bubbles in cold conditions and large elongated grains growing in the temperature gradient direction during mild and stable episodes.
-
2. After this initial stage, the volume of the ice structure reaches an asymptotic value. The water seems to flow mainly at the centre of the free-standing section and is then isolated from the outside cold by the insulating ice volume. The outer surface remains generally dry. The ice microstructure within the free-standing structure keeps track of the crystallization history, with small and large grain microstructures remaining stable. In particular, stalactites are still recognizable even deep in the ice volume. During this stage, the free-standing structure grows slowly, probably mostly at the ice–water interface within the structure where grains are very large since the temperature remains close to 0°C. Otherwise, the water flow deviates outside the structure, possibly as a result of thermal fracturing. In this case, new stalactites form.
-
3. At the end of the season, the collapse of the free-standing section initiates via a large crack that propagates horizontally at the top, just below the upper rock anchoring point. The initiation of this crack seems to be triggered by a large and rapid cooling. Depending on the diameter of the structure at its bottom, this fracture propagation can trigger immediate collapse of the entire free-standing structure. In 2008 this was observed for Shiva Lingam. A more detailed analysis of the mechanical stability of waterfall ice structures, based on internal pressure measurements, will be presented elsewhere.
Observations on less steep structures (e.g. Le Grand Bleu) are more scarce. They suggest, however, that the ice wall, anchored to the rock face for most of the winter, is composed of successive ice layers that can form either from the freezing of seeping water at the surface, associated with large elongated grains, or from snow layers sticking to the ice surface.
Acknowledgements
This work was funded by the Petzl Foundation. Meteorological data were provided by Argentière meteorological station which is part of the French observatory GLACIOCLIM supported by Centre National de la Recherche Scientifique–Institut National des Sciences de l’Univers, France, and the French Ministry of Research. Precipitation data were provided by MeteoFrance. We thank M. Dalmasso for some of the pictures presented here. We also thank the Petzl research department for their support in the design of the portable drilling system. We thank E. Pettit and M. Funk for constructive comments on the manuscript.


