PID strategies are being written around the world right now, and the decisions being made will shape the scholarly record for decades. After 25 years running open scholarly infrastructure—now on behalf of 25,000 members in 167 countries—Crossref has an informed perspective on what those decisions should ideally rest on. Today we’re setting it out in our’s first position paper: Persistent identifiers in research infrastructure policy: the need for a holistic approach. You can read it online or download the PDF; it’s a 16-minute read.
Research is rarely limited to a single contributor performing a single role. Behind every research output are people contributing in various ways: software development, data analyses, methodology design, and much more. Often, the same person contributes in several of these ways. Until now, Crossref metadata could only capture part of that picture, but this is changing with Schema 5.5.
Through user experience research (UXR) initiatives that take into account our diverse membership and community, we can have a continuous, deeper understanding of the role of metadata in our members’ workflows, and ensure that our work continues to meet our community’s needs. Your support is the key to this process, and will positively impact the wider community - and if you’d like to start today, you can take part in our latest initiative: help us improve our Events page by sharing your thoughts on the page’s feedback form.
Our 2026 Community Update took place on 13 May. Two calls, one for the eastern and one for the western time zone, highlighted how our global community is growing, how we’re refining the metadata that supports trust in the scholarly record, and connecting records more effectively through our latest tools.
Crossref Event Data and the importance of understanding what lies beneath the data.
Some things in life are better left a mystery. There is an argument for opaqueness when the act of full disclosure only limits your level of enjoyment: in my case, I need a complete lack of transparency to enjoy both chicken nuggets and David Lynch films. And that works for me. But metrics are not nuggets. Because in order to consume them, you really need to know how they’re made. Knowing the provenance of data, along with the context with which it was derived, provides everyone with the best chance of creating indicators which are fit for purpose. This is just one of the reasons why we built the Event Data infrastructure with transparency in mind.
The transparency problem
For the scholarly community, alternative metrics to citation count (‘altmetrics’) are becoming increasingly popular as they can offer rich and expedited insight into today’s diverse and dynamic research environment. Research artifacts undergo an extended life online as they’re linked, shared, saved and discussed in forums both within and beyond the traditional academic ecosystem. Data on these interactions are initially fragmented and buried within platforms like social media, blogs and news sites. Downstream, there are several value-add services that collate and present that data as a single, aggregated count. We see individual data points like ‘paper X was tweeted 22 times’, and ‘paper X is referenced 16 times on Wikipedia’ being combined, homogenised, weighted and expressed as a single figure, a calculated number serving as a proxy for value. But altmetrics alone don’t tell the whole story, and how they are calculated is not without idiosyncrasy or politics. As we each have our own unique voice and perspective, we need to ensure we understand the lenses through which these metrics are made in order to consume them effectively.
The 2015 Metric Tide report highlighted transparency as one of the five dimensions of responsible metrics. Having access to the context used to create a metric — the provenance of the original data as well as full transparency around its extraction, processing and aggregation — helps consumers to use the data meaningfully and allows for comparison across third-party vendors. But transparency is difficult to achieve when, as the report notes, the systems and infrastructure for collecting and curating altmetrics-style data are fragmented and have limited interoperability.
In the academic community, underlying centralised systems include ORCIDs to identify people and DOIs to identify items. But we’re missing a transparent, centralised infrastructure for describing and recording the relationships between objects and resources1. These relationships, or links, occur outside publisher platforms and can provide valuable information about the interconnectivity and dissemination of research. Dedicated infrastructure for collecting these relationships would provide a data source for those interested in altmetrics to build upon.
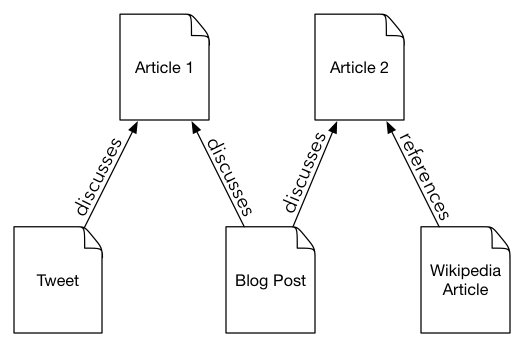
Figure 1.1 Example of some relationships between articles and activity on the web
At Crossref, we call these relationships Events. An Event is the record of a claim made about the existence of a relationship between a registered content item (i.e. a DOI) and a specific activity on the web. Events include:
a DataCite dataset DOI contains a link to a Crossref article DOI
an article was referenced in Wikipedia
an article was mentioned on Twitter
an article has a Hypothes.is annotation
a blog contains a link to an article
In collaboration with DataCite, we are collecting Events for the DOIs registered with our organisations and are making that data available for others in the community to use. This is the Event Data infrastructure, with which we’re plugging the gap in open scholarly relationships infrastructure.
https://doi.org/10.64000/kattr-5k219
The Event Data infrastructure
Crossref and DataCite have for many years provided a centralised location for bibliographic metadata and links, and a facility to help our members register Persistent Identifiers (DOIs) for their content. With nearly 100 million DOIs registered with Crossref, we know where research lives. Which got us thinking — could we use these links to find out more about the journey research undertakes after publication? Could we express these interactions as links without any aggregation or counts so it could be maximally reused? And if so, could we then provide this data in an open, centralised, structured format? The answer was yes, subject to some challenges:
Querying for individual DOIs wasn’t scalable for our full corpus of 100 million items, so we had to find something else.
Not everyone uses the DOI link (not a surprise!). Most people will link directly to the publisher’s site. This means we need to look for links using both the DOI and article landing page URLs.
When we find people referring to registered content using its landing page, we find the DOI for that content item so that the link can be referenced in our data set in a stable, link-rot-proof way.
We don’t always know the article landing page URL for every DOI upfront because like many relationships, the one between DOIs and URLs is complicated.
We began by asking the wrong questions and as a result we got the wrong type of data back: instead of returning a record of individual actions, we were returning aggregated counts. Aside from not meeting our use case, aggregation requires the curation of an ever-churning dataset in order to keep totals updated, which is not scalable for the number of DOIs in our corpus.
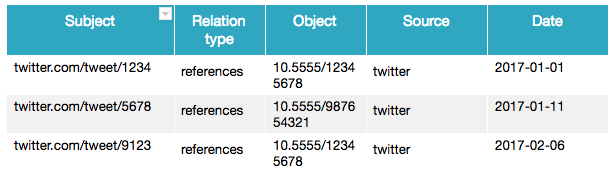
We soon learnt to ask the right questions. One pivotal change in approach was that instead of counts, we asked instead ‘what activity is happening on Twitter for this article?’. Our data went from ‘DOI X was mentioned 20 times on Twitter as of this date’ to ‘tweet X mentions DOI X on this date’. The data are now represented as a subject-verb-object triple:
Figure 1.2 Triple table.
Ultimately this has allowed us to represent actions like Wikipedia page edits as individual atomic actions (i.e an Event) rather than as a dataset that changes over time.
Being open about the provenance of altmetrics with Event Data
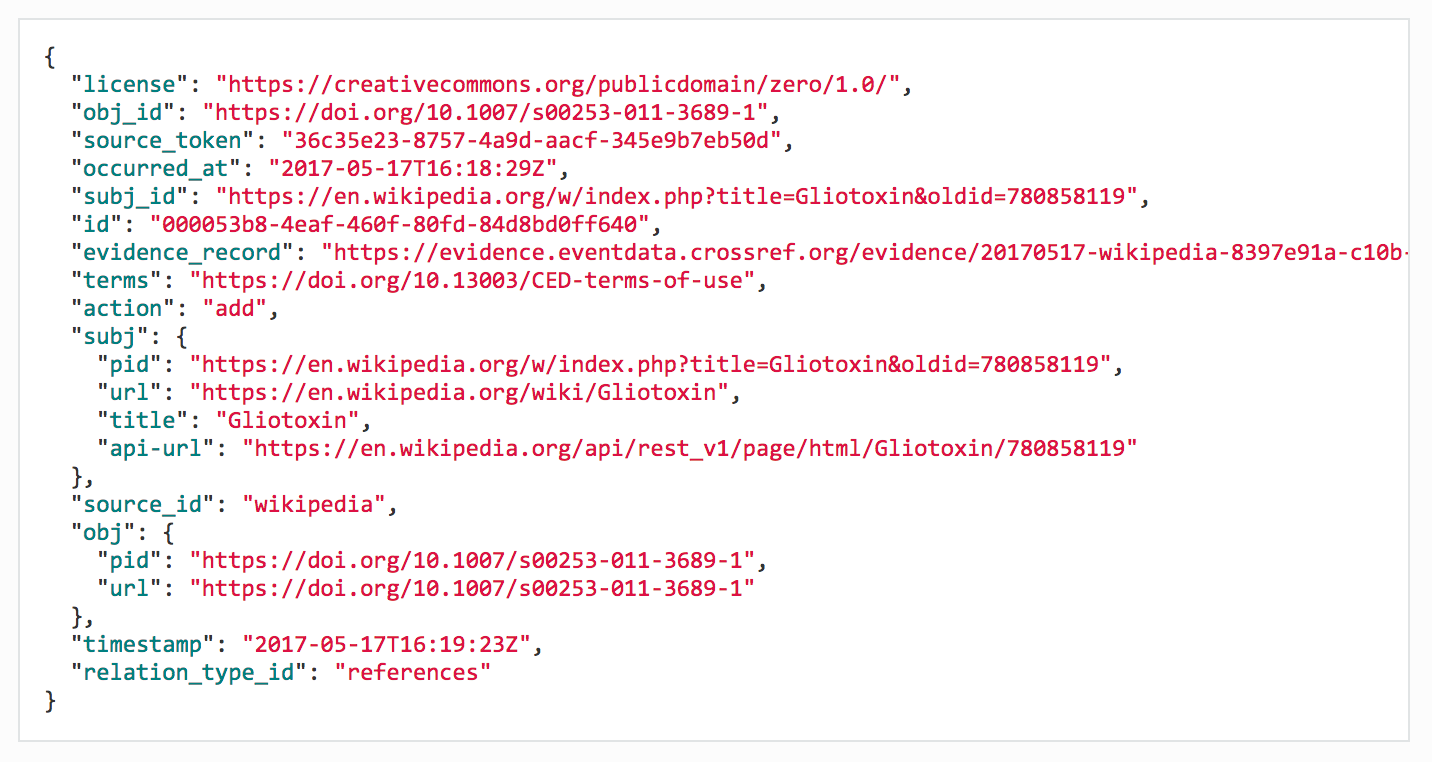
Crossref Event Data (the Crossref-specific service powered by the shared Event Data infrastructure) has evolved beyond a link store to become a continual stream of Events; each Event tells a new part of the story. Rather than constantly updating an Event whenever a new action takes place, we add a new one instead:
Figure 1.3 A Wikipedia Event.
Events answer a whole range of questions, such as:
What links to what?
How was the link made?
Which Agent collected the Event?
Which data source?
When was the link observed?
When do we think the link actually happened?
What algorithms were used to collect it?
Where’s the evidence?
We’re collecting data from a diverse range of platforms including Twitter, Wikipedia, blogs and news sites, Reddit, StackExchange, Wordpress.com and Hypothes.is. This means that when we observe a link in these platforms to what we think is a DOI, we create an Event and a corresponding Evidence Record to represent our observation. We also have Events to represent the links between research items registered with Crossref and DataCite - for example, when a Crossref DOI cites a DataCite DOI and vice versa.
The provenance of the data is fully transparent and is made available to everyone via an open API. We call this the evidence trail. The record of each link (‘Events’) as well as the corresponding evidence can then be used to feed into tools for impact measurement, discoverability, collaboration and network analysis.
Therefore, one application of Event Data is as an underlying, transparent data source for altmetrics calculations. For example, you might want to know the total number of times your paper has been mentioned on Twitter to date. If I told you that the number was 22, what does that actually mean? Do you know whether I counted both tweets and retweets? Do you consider both of these actions as equal? Is the sentiment of the tweet important to you? Was it a human or a bot that initiated a tweet? Are you interested in tweets containing links to multiple representations of your paper or do you only want to track mentions of your version of record (the final published copy)? With Event Data as your underlying data source, you can answer these questions.
Not only transparent in data, transparent by design
The National Information Standards Organisation (NISO), a US organisation responsible for technical standards for publishing, bibliographic and library applications, has developed a set of recommendations for transparency in their Alternative Assessment Metrics Project report, as well as a Code of Conduct for both altmetric practitioners and aggregators that aims to help improve the quality of altmetrics data. The working groups recognised that without transparency and conforming to a recognised standard, altmetric indicators “are difficult to assess, and thus may be seen as less reliable for purposes of measuring influence or evaluation”1.
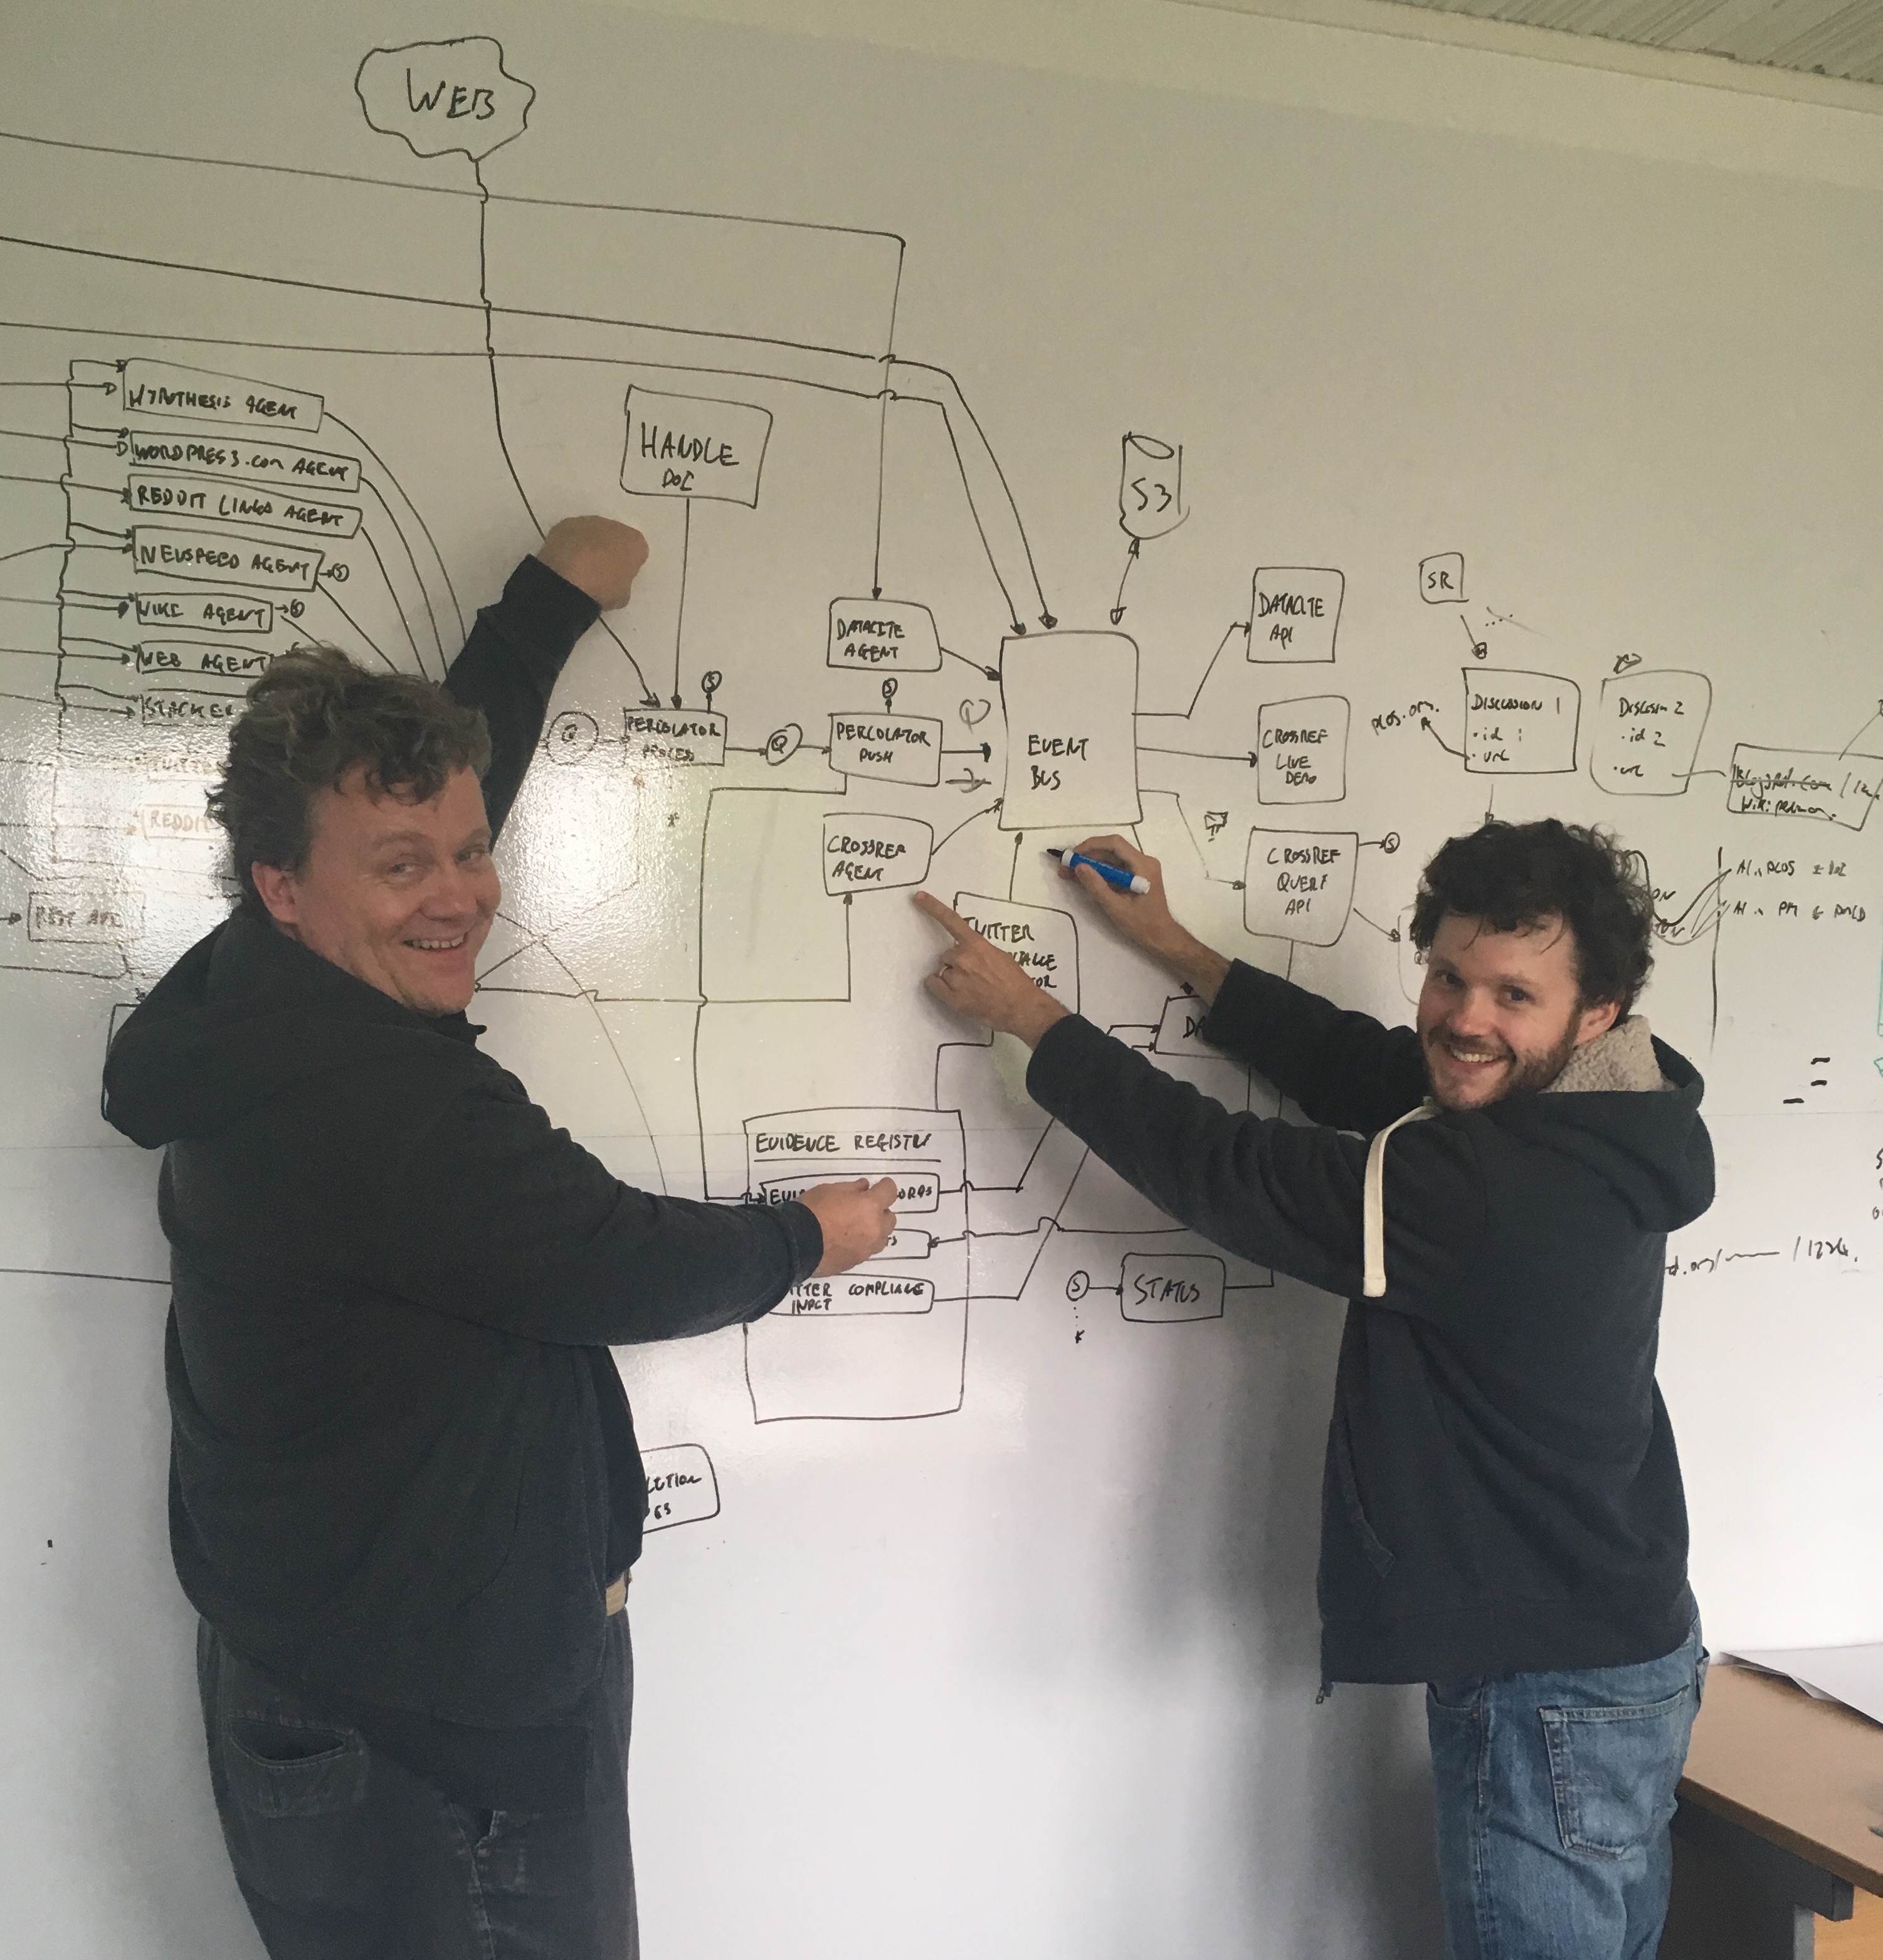
Figure 1.4 Martin Fenner (DataCite) and Joe Wass (Crossref) drawing plans for the Event Data infrastructure.
The outcome of our involvement in the NISO recommendations is that Crossref Event Data is a service that is transparent by design. We have opened up our entire extraction and processing workflow so that we can clearly demonstrate the context and environment that was used to generate an Event. This evidence is a core component of our transparency-first principle.
Building services on Event Data
There are some really exciting ways that people are already using Event Data, and we’re still only in beta. Our aim has always been to create an open, portable, transparent data set that can be used by our diverse community including researchers, application developers, publishers, funders and third-party service providers. We have already seen data from our service used in recent research studies, impact reports and even a front-end tool. Launched recently as a prototype, ImpactStory’s Paperbuzz.org uses Event Data as one of its data sources for tracking the online buzz around scholarly articles. Jason Priem, cofounder of ImpactStory, notes:
“Because Crossref Event Data is completely open data, we believe it’s a game-changer for altmetrics. Our latest project, Paperbuzz.org, is just the first of a whole constellation of upcoming tools that will add value on top of Crossref’s open data.”
We are working towards launching Crossref Event Data as a production service. In the meantime though, please do take a look at our comprehensive User Guide. Hopefully you’ll be inspired to go make something cool using the data! Events are being collected constantly; take a look below as they stream in from our data sources or visit our live stream demo site to watch in real time.
Figure 1.5 Screen capture of Crossref Event Data live stream demo.
As the service matures, we’ll continue to add new platforms to track and I also encourage anyone with article link data to get in touch to discuss how we can share it with the community via Event Data.
For researchers in particular, I’m really keen to hear your thoughts on our data model and about the things we could additionally provide you with from an infrastructure perspective that would best support your research needs.
And if you’re a publisher, take a look at our Event Data best practice guidelines — there’s some really important information in there about how you can help give us the best chance possible of collecting Events for your registered content.
And finally, if you’re a consumer of altmetrics data, I encourage you to ask questions. Ask your altmetrics vendors about how they gather their data and what context they apply to the aggregation of the metrics they supply. Ask yourself what behaviours you are interested in tracking and equally those you are not. Think about the endgame; about the type of impact you’re truly trying to measure and the story you want to tell. Because it’s these questions that will help you choose indicators that are the best fit for your own unique narrative.