7 minute read.You do want to see how it’s made — seeing what goes into altmetrics
There’s a saying about oil, something along the lines of “you really don’t want to see how it’s made”. And whilst I’m reluctant to draw too many parallels between the petrochemical industry and scholarly publishing, there are some interesting comparisons to be drawn.
Oil starts its life deep underground as an amorphous sticky substance. Prospectors must identify oil fields, drill, extract the oil and refine it. It finds its way into things as diverse as aspirin, paint and hammocks. And as I lie in my hammock watching paint dry, I’m curious to know how crude oil made its way into the aspirin that I’ve taken for the headache brought on by the paint fumes. Whilst it would be better if I did know how these things were made, not knowing doesn’t impair the efficacy of my aspirin.
Altmetrics start life deep inside a number of systems. Data buried in countless blogs, social media and web platforms must be identified, extracted and refined before it can be used in products like impact assessments, prompts to engagement, and even tenure decisions. But there the similarity ends. Like the benzene in my aspirin, the data that goes into my favourite metric has come a long way from its origins. But that doesn’t mean that I shouldn’t know how it was made. In fact, knowing what went into it can help me reason about it, explain it and even improve it.
Heavy industry or backyard refinery?
When you head out to fill your car, you buy fuel from a company that probably did the whole job itself. It found the crude oil, extracted it, refined it, transported it and pumped it into your car. Of course there are exceptions, but a lot of fuel is made by vertically integrated companies who do the whole job. And whilst there are research scientists who brew up special batches for one-off pieces of research, if you wanted to make a batch of fuel for yourself you’d have to set up your own back-yard fractional distillation column.
Because the collection of a huge amount of data must be boiled down into altmetrics, organisations who want to produce these metrics have a big job to do. They must find data sources, retrieve the data, process it and produce the end product. The foundation of altmetrics is the measurement of impact, and whilst the intermediary data is very interesting, the ultimate goal of a metric is the end product. If you wanted to make a new metric you’d have two choices: set up an oil refinery (i.e. build a whole new system, complete with processing pipeline) or a back-yard still (a one-off research item). Either option involves going out and querying different systems, processing the data and producing an output.
Being able to demonstrate the provenance of a given measurement is important because no measurement is perfect. It’s impossible to query every single extant source out there. And even if you could, it would be impossible to prove that you had. And even then, the process of refinement isn’t always faultless. Every measurement out there has a story behind it, and being able to tell that story is important when using the measurement for something important. Data sources and algorithms change over time, and comparing a year-old measurement to one made today might be difficult without knowing what underlying observations went into it. A solution to this is complete transparency about the source data, how it was processed, and how it relates to the output.
Underlying data
This is where Crossref comes in. It turns out that the underlying data that goes into altmetrics is just our kind of thing. As the DOI Registration Agency for scholarly literature, it’s our job to work with publishers to keep track of everything that’s published, assign DOIs and be the central collection and storage point for metadata and links. Examples of links stored in Crossref are between articles and funders, clinical trial numbers, preprints, datasets etc. With the Event Data project, we are now collecting links between places on the web and our registered content when they’re made via DOIs or article landing pages.
This data has wider use than just than altmetrics. For example, an author might want to know over what time period a link to their article was included in Wikipedia, and which edit to the article was responsible for removing it and why. Or, in these days of “fake news”, someone may want to know everywhere on Twitter that a particular study is referenced so they can engage in conversation.
Whilst the field of altmetrics was the starting point for this project, our goal isn’t to provide any kind of metric. Instead, we provide a stream of Events that occurred concerning a given piece of registered content with a DOI. If you want to build a metric out of it, you’re welcome to. There are a million different things you could build out of the data, and each will have a different methodology. By providing this underlying data set, we hope we’ve found the right level of abstraction to enable people to build a wide range of things.
Every different end-product will use different data and use different algorithms. By providing an open dataset at the right level of granularity, we allow the producers of these end-products to say exactly which input data they were working with. By making the data open, we allow anyone else to duplicate the data if they wish.
Sticky mess
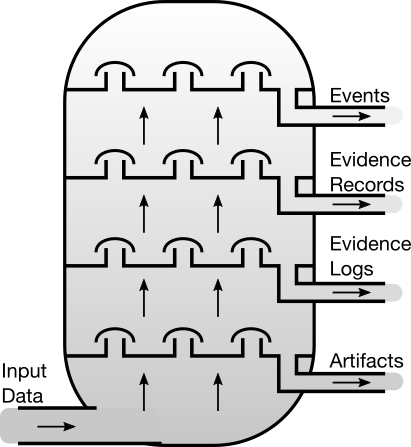
To finish, let me return to the sticky mess of the distillation column. We identify sources (websites, APIs and RSS feeds). We visit each one, and collect data. We process that data into Events. And we provide Events via an API. At each stage of processing, we make the data open:
- The Artifact Registry lists all of the sources, RSS feeds and domains we query.
- The Evidence Registry lists which sites we visited, what input we got, what version of each Artifact was used, and which Events were produced.
- The Evidence Log describes exactly what every part of the system did, including if it ran into problems along the way.
- The Events link back to the Evidence so you can trace exactly what activity led up to the Event.
- All the code is open source and the version is linked in the Evidence Record, so you can see precisely which algorithms were used to generate a given Event.
- Anyone using the Data can link back to Events, which in turn link back to their Evidence.
The end-product, Events, can be used to answer altmetrics-y questions like “who tweeted my article?”. But the layers below that can be put to a range of other uses. For example:
- “Why does publisher X have a lower Twitter count?”. The Evidence Logs might show that they tend to block bots from their site, preventing data from being collected.
- “Why did their Twitter count rise?”. The Evidence Logs might show that they stopped blocking bots.
- “What does Crossref think the DOI is for landing page X?”. A search of the Evidence Logs might show that the Event Data system visited the page on a given date and decided that it corresponded to DOI Y.
- “Which domains hold DOI landing pages?”. The “Domains” Artifact will show the domains that Event Data looked at, and the Evidence Logs will show which versions were used over time.
By producing not only Events, but being completely transparent about the refinement process, we hope that people can build things beyond traditional altmetrics, and also make use of the intermediary products as well. And by using open licenses, we allow reuse of the data.
See you in Toronto!
There’s so much more to say but I’ve run out of ink. To find out more, come to 4:AM Altmetrics Conference! I’ll be speaking at the conference in Session 10 on the 28th. I’ll also be at the Altmetrics Workshop on the 26th. Stacy Konkiel and I are hosting the Hackathon on the 29th, where you can get your hands on the data. See you there!
This blog post was originally posted on the 4:AM Altmetrics Conference Blog.