


Introduction
Hail fall during thunderstorms can create severe damage and losses to agriculture, car holders and real estate. In terms of insured losses, the two hailstorms in Germany on 27–28 July 2013 were the costliest natural disasters worldwide in that year, with total damage estimated at more than 6 billion Euros (Kunz and Kugel, Reference Kunz and Kugel2015; Puskeiler and others, Reference Puskeiler, Kunz and Schmidberger2016). Aircraft are also strongly impacted by hailstones when passing through hailstone regions and clouds, potentially causing serious accidents.
Interest in hailstone microstructures is not new (Crammer, Reference Crammer1903) and was first motivated by the understanding of hailstone formation in clouds, based, for example, on isotopic studies associated with direct microstructural observations (Schuma, Reference Schuma1938; List, Reference List1960b; Knight and Knight, Reference Knight and Knight1968; Jouzel and others, Reference Jouzel, Merlivat and Roth1975; Macklin and others, Reference Macklin, Carras and Rye1976; Macklin, Reference Macklin1977). More recently, a large range of studies focused on understanding and modeling of the impact of hailstones on structures (see e.g. Anghileri and others, Reference Anghileri, Castelletti, Invernizzi and Mascheroni2005; Kim and Keune, Reference Kim and Keune2007; Deconinck, Reference Deconinck2019). In most of these studies, modeling approaches are validated with laboratory experiments in which hailstones are replicated by artificial ice samples, sometimes spherical, with microstructures that are mostly far from realistic (Combescure and others, Reference Combescure, Chuzel-Marmot and Fabis2011; Guégan and others, Reference Guégan2011; Pernas-Sánchez and others, Reference Pernas-Sánchez, Artero-Guerrero, Varas and López-Puente2015).
Grain size and texture (here used to denote the distribution of crystallographic orientations) are known to influence the mechanical behavior of ice, in particular in the static brittle regime (see Schulson and Duval, Reference Schulson and Duval2009, for a review). Impact of hailstones occurs in a dynamical regime (at strain rates higher than several s−1). For most materials, it is assumed that porosity (density, shape and size distribution of pores) controls fracture propagation during dynamic behavior (Forquin and Erzar, Reference Forquin and Erzar2010) and this is also true for ice (Georges and others, Reference Georges, Saletti, Montagnat, Forquin and Hagenmuller2021). However, very few studies have considered the effect of microstructure and texture under such conditions. This may be due to the lack of accurate data and the difficulty to design hail-like microstructures and textures.
Hailstone microstructure results from the formation history in cumulonimbus clouds. Hailstones formation is related to convective instabilities, atmospheric humidity, and to a lesser extent wind and aerosol content in the cloud. From Knight and others (Reference Knight, Ehhalt, Roper and Knight1975) and Macklin and others (Reference Macklin, Carras and Rye1976) early studies, formation conditions can be constrained indirectly by measuring the isotopic signatures in the different ice layers forming a hailstone. Some authors favor growth of hailstones during re-injection of embryos and updraft, for example based on isotopic measurements (Jouzel and others, Reference Jouzel, Merlivat and Roth1975) or modeling (Browning and Foote, Reference Browning and Foote1976). Large hailstones may also form along a simple trajectory with no recirculation (Knight and others, Reference Knight, Ehhalt, Roper and Knight1975). A recent modeling study revisit the impact of updraft trajectory conditions on the hailstone size (Kumjian and Lombardo, Reference Kumjian and Lombardo2020).
Hailstones form out of embryos that mostly consist of graupel (List, Reference List1958), but they may also originate from frozen water drops (Rasmussen and Heymsfield, Reference Rasmussen and Heymsfield1987). Depending on temperature and aerosol content, hailstone growth can result from the rapid freezing of supercooled water (Macklin, Reference Macklin1977), but also from the freezing of a liquid shell and all intermediate cases. Hailstone growth is separated into two main regimes, wet and dry growth. During dry growth, accretion of water occurs by immediate freezing upon contact. The minimum temperature of growth is constrained by the lowest supercooled water temperature of −36°C. Hail growth is termed wet when a fraction of water remains liquid at the surface of the growing hail or graupel. Wet growth was extensively studied in the laboratory, with pioneer work to be found in List (Reference List1960b) and Macklin and Ludlam (Reference Macklin and Ludlam1961). Wind-tunnel experiments enabled Lesins and List (Reference Lesins and List1986) to show that wet growth can be further subdivided, ranging from moist, to spongy and finally soaked, depending on the temperature, water content and gyration rate, all leading to different microstructures. Under extreme conditions, hail microstructure can result in dendritic structures such as observed by Knight and Knight (Reference Knight and Knight2005) on large hailstones. Aerosols may also come into play during growth (Ilotoviz and others, Reference Ilotoviz, Khain, Benmoshe, Phillips and Ryzhkov2016). High concentrations of aerosols increase the number of available supercooled droplets and favor accretion of large hailstones. A lower concentration of aerosols will, in contrast, favor the formation of more numerous but smaller hailstones by water droplet freezing. Gyration during falling impacts the final shape of hailstones, and leads to approximately oblate spheroids, instead of spheres that are often used for modeling (see e.g. Knight and Knight, Reference Knight and Knight1970; García-García and List, Reference García-García and List1992).
As a consequence of their complex formation processes, large hailstones mainly resemble oblate spheroids, and often consist of alternating layers of ‘white’ and ‘dark’ ice. The difference between these layers is directly related to porosity and grain size. White (opaque) ice layers, composed of very small grains surrounded by tiny air bubbles, grow under dry conditions (Macklin, Reference Macklin1977). Transparent layers (that appear ‘dark’ in comparison with white layers) form under wet conditions during which a liquid layer remains in contact with the ice surface over longer periods. As a consequence, grains are generally larger and fewer bubbles are trapped. A hailstone may encounter both growth conditions repeatedly, depending mainly on its falling or rising velocity, temperature and liquid water content in the cloud. When analyzing hailstones, it should be borne in mind that the microstructure can change due to recrystallization after hailstone formation, especially when reaching higher temperatures on the ground (Macklin, Reference Macklin1977; Knight and Knight, Reference Knight and Knight2005).
Although hailstone microstructures have been extensively studied and modeled, only very few studies exist that investigated the crystallographic orientations of ice crystals in large hailstones. Knight and Knight (Reference Knight and Knight1968) used surface etching to determine the crystallographic c-axis orientations of large columnar grains in the outer shells of hailstones. With the low resolution of their method, only the larger crystals could be evaluated and represented by one single orientation measurement each. The c-axes were found to be oriented radially, in the growth direction, and from this observation Knight and Knight (Reference Knight and Knight1968) disproved the hypothesis of a spongy growth for the studied large hailstones.
In this study, we present the first high-resolution microstructure and texture measurements on large hailstones (a few centimeters in diameter) that were gathered from the town of Tübingen in southwest of Germany, during a violent storm of 28 July 2013 (Kunz and Kugel, Reference Kunz and Kugel2015; Puskeiler and others, Reference Puskeiler, Kunz and Schmidberger2016) and in the southwest of France on 31 August 2015. Our data may offer complementary constraints for modeling-based approaches to simulate and predict hailstone formation and impact. They may also help to improve the design of ice-growing techniques to better mimic natural hailstones.
Characterization of hailstone textures
Hailstone collection
Hailstones from Germany were collected by PDB and CCB about a quarter of an hour after the storm that took place in the southwest German town of Tübingen, on 28 July 2013. They were piled up on the street and balcony, while the temperature had dropped to ~20°C. They were immediately stored at ~−32°C until three of them (samples G1–3) were analyzed.
The French hailstones were collected by volunteers from the ANELFA association (Association Nationale d'Etude et de Lutte contre les Fleaux Atmospheriques, http://www.anelfa.asso.fr/), in the southwest of France on 31 August 2015. They were put in silicon oil, and kept at −28°C before being send to IGE (Institut of Geosciences of Environment) where they were stored at −10°C until four of them were analyzed (samples F1–4). One of these large hailstones is illustrated in Figure 1.

Fig. 1. Flat hailstone from the south west of France (F1) observed under polarized light.
Method
Ice Ih, the main component of hailstones, is characterized by a hexagonal crystallographic structure and an optical birefringence. The long axis of the hexagonal structure, the c-axis, is also the optical axis. Observation of thin sections of ice under cross-polarized light has therefore been used for a long time to determine the orientation of c-axes of individual crystals. Classically performed by manual rotation and inclination of the thin section on a Rigsby stage (Rigsby, Reference Rigsby1951), analyses are today automatic, fast and of high accuracy thanks to Automatic Ice Texture Analyzers (AITA). The AITA used in this study is inherited from developments by Russell-Head and collaborators (http://www.russellheadinstruments.com), from the early 2000 (Russell-Head and Wilson, Reference Russell-Head and Wilson2001; Wilson and others, Reference Wilson, Russell-Head and Sim2003, Reference Wilson, Russell-Head, Kunze and Viola2007), based on the idea that rotation and inclination of the thin section can be automatized, and that the c-axes distribution can be derived from a set of digital images of the thin section taken from these different angles and inclinations. A full description of the automated procedure of the AITA version used here can be found in Peternell and others (Reference Peternell, Kohlmann, Wilson, Seiler and Gleadow2009), and we will provide the main technical details here.
In the AITA version used in this study, the thin section is positioned on a stage that moves horizontally to move the 10 mm×10 mm camera field of view over the full section. Over this field of view, stacks of images are taken from eight inclined quasi-monochromatic light emitting diodes (LEDs) and three vertical white LEDs that mimic the rotation of the section between cross polarizers. These stacks of images are treated by AITA software to determine the extinction planes that contains the c-axis. From this the c-axis orientation is calculated for each pixel in the image and reported as (1) its azimuth (measured clockwise from north, between 0° and 360°), (2) its colatitude or plunge (between 0° and 90°, corresponding to a c-axis parallel and perpendicular to the section plane, using a lower-hemisphere projection) and (3) a quality factor (QF) that estimates the accuracy of the extinction planes matching (between 0 and 100). Our equipment enables c-axis orientation measurements at a spatial resolution down to 5 μm. In this study, the resolution was set to 10 μm as a necessary compromise between the size of the data files and the minimum measurable grain size (which is also constrained by a minimum thin section thickness). The angular resolution is ~3° (Peternell and others, Reference Peternell, Russell-Head and Wilson2011). In agreement with the detailed AITA technical study performed by Peternell and others (Reference Peternell, Kohlmann, Wilson, Seiler and Gleadow2009, Reference Peternell, Russell-Head and Wilson2011), the QF threshold was set at 70 or 75 in order to secure the reliability of the c-axis orientation measurements. In doing so, pixels from grain boundaries and bubbles are automatically removed.
All results obtained with the AITA are analyzed with an in-house python script (https://github.com/ThomasChauve/aita). This script draws map of the thin section, using a c-axis orientation based color lookup table (shown as inset in the figures). It also provides a pole figure that corresponds to a lower-hemisphere equal-area stereographic projection of the c-axis orientations (Fig. 2). Owing to the large number of pixel-data available, only a random selection of 10 000 c-axis orientations (above the QF threshold) is displayed. The color scale for pole figures represents the (normalized) width of the density probability function (obtained from a kernel density estimation). Pole figures are shown in the (x, y) plane that corresponds to the thin section plane. The z-axis is perpendicular to the thin section plane and to the figures, unless stated differently.
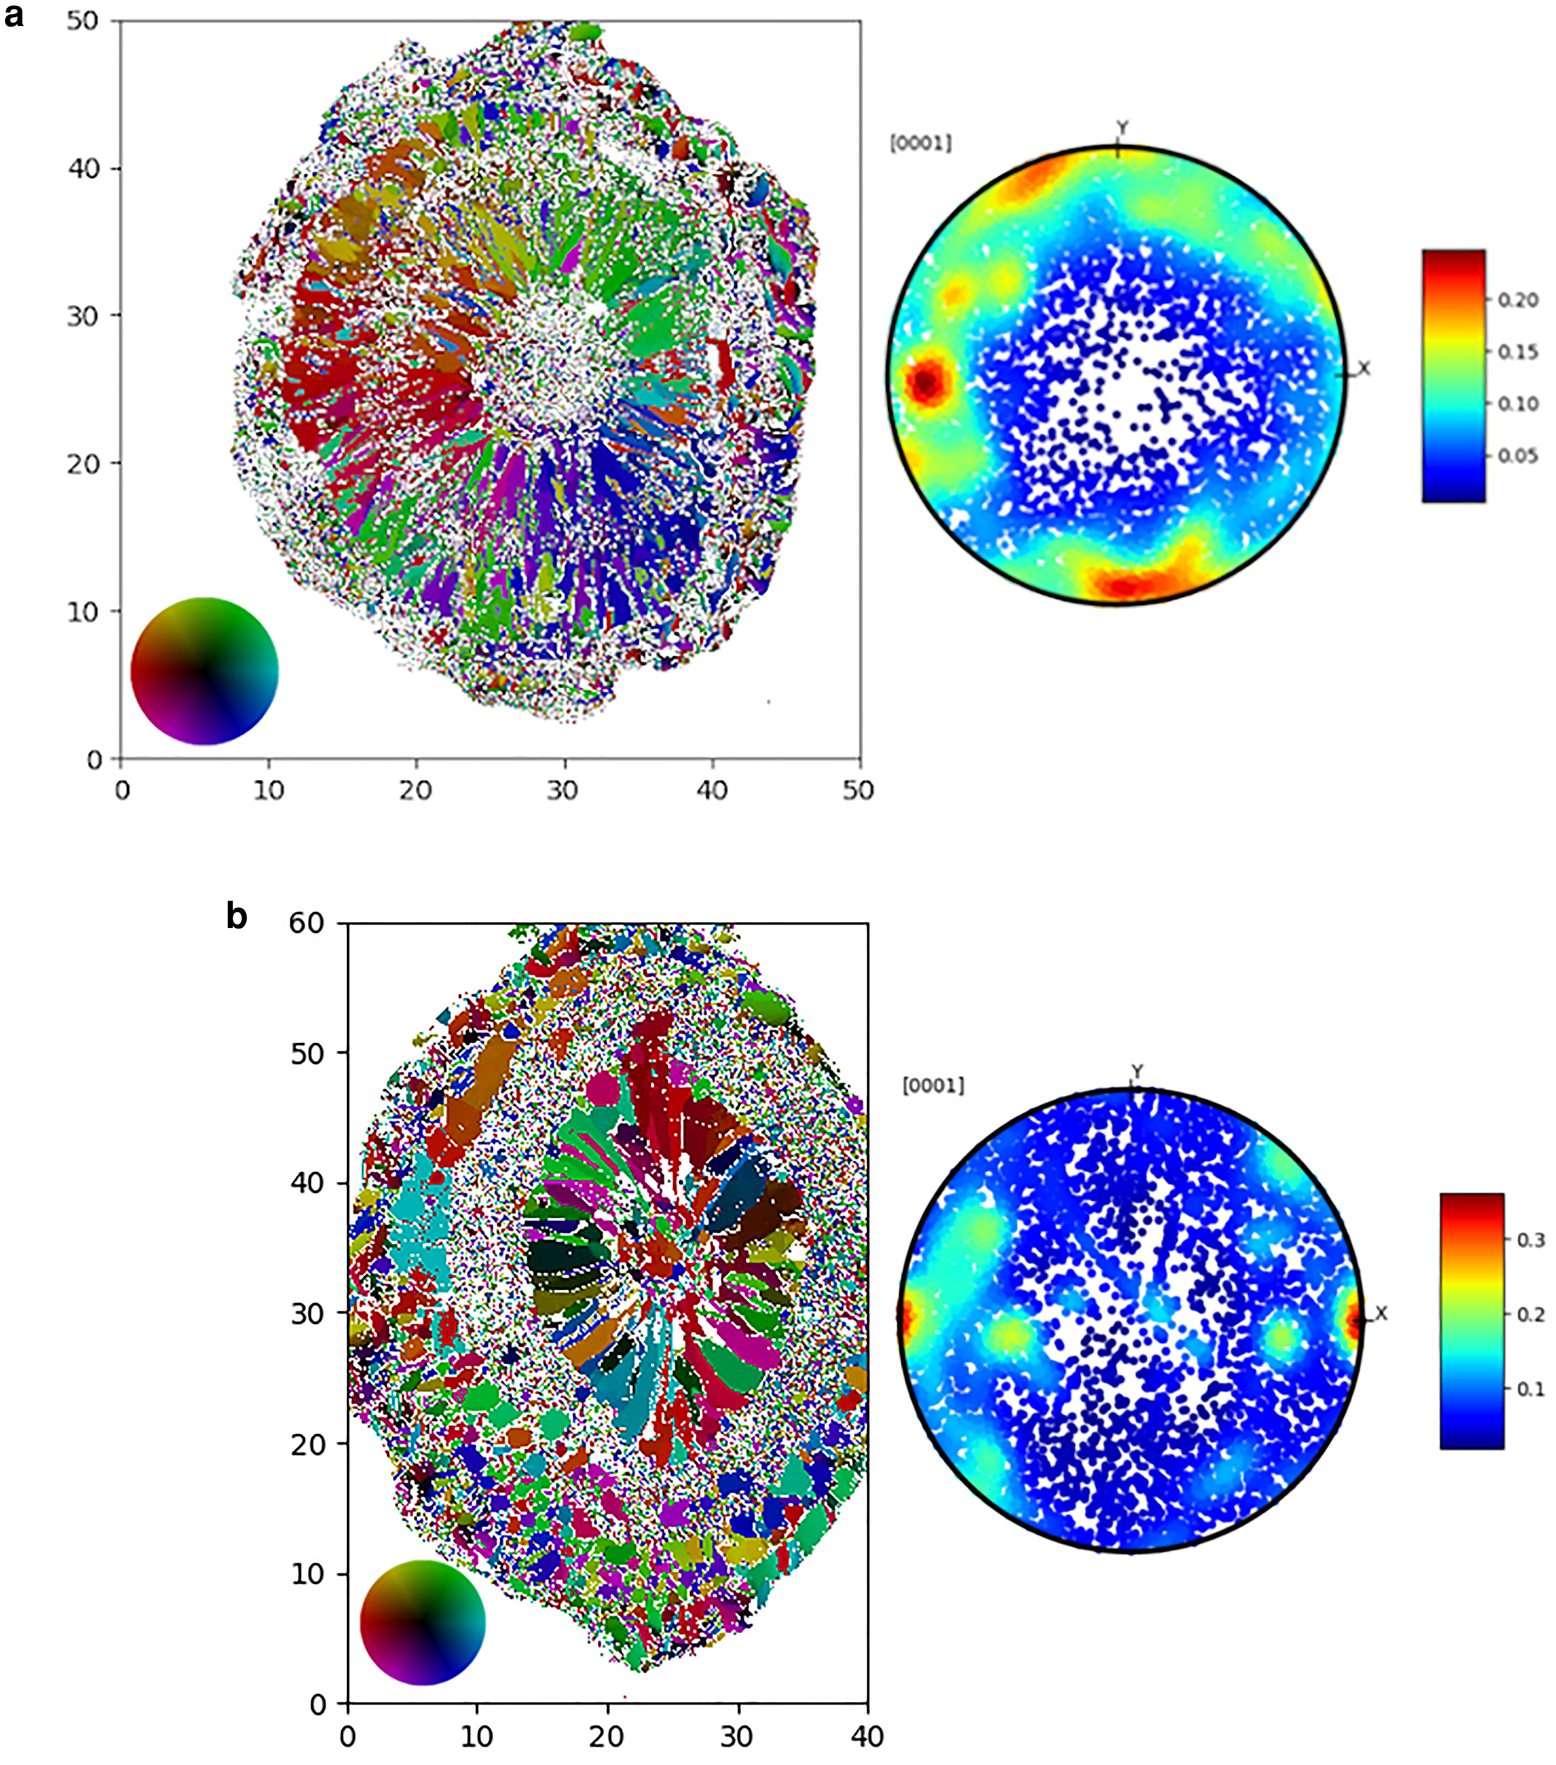
Fig. 2. Illustration of AITA data obtained from German hailstone G1 (a) and French hailstone F1 (b). For each hailstone: Left: orientation color-coded image obtained after a filtering with QF set to 75. White areas are excluded for further analyses. The orientation color-code is given by the color wheel on the bottom left of the images (lower-hemisphere, equal area stereographic projection). Scale is mm. Right: c-axis orientations plotted on a pole figure. The color-code corresponds to the density of pixels. The (x, y) plane is the plane of the thin section.
A thin section is a 2-D sample of a 3-D object and therefore may provide biased information. In order to test the representativeness of the thin-section based data, two perpendicular section of one hailstone were analyzed. The orientation maps and pole figures (Fig. 3) of these two thin sections show similar microstructures and textures. This confirms, at least qualitatively, the concentric nature of the texture and microstructure, and that the 2-D analysis of thin sections provides meaningful results.

Fig. 3. Microstructures and pole figures of two perpendicular thin sections of the French hailstone F2.
Most of the studied hailstone microstructures are composed of quasi-ellipsoidal layers. We used individual elliptical masks to provide and visualize data of individual layers (Figs 5, 6).
Opaque or cloudy layers reflect the porosity of hailstones (see for instance Fig. 1). In the orientation maps, porosity appears as white areas without any successful orientation measurements, similarly to grain boundaries or mis-indexed areas (Figs 2, 3). In order to reveal and quantify the porosity, X-ray micro-computed tomography (microCT) proved to be perfectly suited for porous ice and snow (see Coléou and others, Reference Coléou, Lesaffre, Brzoska, Ludwig and Boller2001, for pioneering work). Here, we present a preliminary study made on a 40×20×20 mm3 sample from the French hailstone F2. The sample was scanned with the Easytom XL nano tomograph from RX Solutions of the CMTC (Consortium des Moyens Technologiques Communs) platform at the Grenoble-INP (Institut National Polytechnique) (Fig. 4), maintained at −10°C in a cold cell during the acquisition (Burr and others, Reference Burr2018). One acquisition was done to cover the whole sample volume with a (cubic) voxel size of 5 μm, and another one to focus on a smaller volume and increase the resolution to a voxel size of 2 μm. The high contrast between air and ice, which ensures an easy threshold-based segmentation of the 3-D binary images, facilitates the reconstruction of the 3-D microstructure from the raw grayscale density images. Figure 4 shows a 3-D view of the reconstructed porous microstructure for the two volumes (large volume and low resolution in Fig. 4b, small volume and higher resolution in Fig. 4c).

Fig. 4. Micro-computed X-ray tomography visualization of the 3-D porosity in one part of the French hailstone F2 (a) with a resolution of 5 μm (b) and within a smaller volume, with a resolution of 2 μm (c). Pores are shown in color, ice is transparent.
Since a full statistical evaluation of the porosity of hailstones is beyond the scope of the paper, we here only provide preliminary data as an illustration. The porosity is estimated to be ~1.5 vol% in the larger sample scanned (Fig. 4b) and ~2.2 vol% in the ‘zoomed’ part (Fig. 4c). In this last volume, two very large pores account for 26.5% of the total porosity, each one having a volume of ~0.1 mm3. Pores smaller than the voxel size cannot be observed which underestimates the porosity. Porosity appears very heterogeneously distributed within the different layers with small and large pores co-existing in the coarse-grained layers.
Observations and analyses
Seven large hailstones of diameter between 3.5 and 5 cm were studied, four from the southwest of France storm (samples F1–4) and three from the German storm (samples G1–3). No clear distinction in the microstructures and textures could be made related to the geographic location of the presented hailstones. However, we have observed two types of dominant textures for the hailstones studied, which we illustrate in the following and for which we will propose interpretations in the next section. The illustration will be supported visually by detailed characterizations of two representative hailstones. Observations done on the other hailstones can be found in the Appendix.
In the following we will refer to ‘core’ when mentioning the inner part of the hailstone, since we cannot accurately assert that this corresponds to the embryo. Hypotheses about a related embryo type will nevertheless be given.
Hailstone F1 is oblate spheroidal with a major axis of ~5.2 cm, a minor axis of ~4 cm and a thickness of ~1.5 cm (Fig. 1). The AITA analysis (Fig. 2) shows a concentric zonation with variations in grain size and shape. The pole figure of the entire hailstone shows a girdle-type texture, with most c-axes oriented close to the plane of the thin section.
Figure 5 presents four individual concentric layers that were isolated from the F1 hailstone together with their corresponding pole figures. The core of the hailstone (Fig. 5a) is composed of a large grain surrounded by several smaller grains. Since the blue and red colors correspond to almost the same orientation but with opposite azimuth (see color wheel in Fig. 5), the core of hailstone F1 is composed of grains with almost identical c-axis orientations. From this observation, we can hypothesize that the embryo resulted from a frozen droplet that further grew under wet conditions.
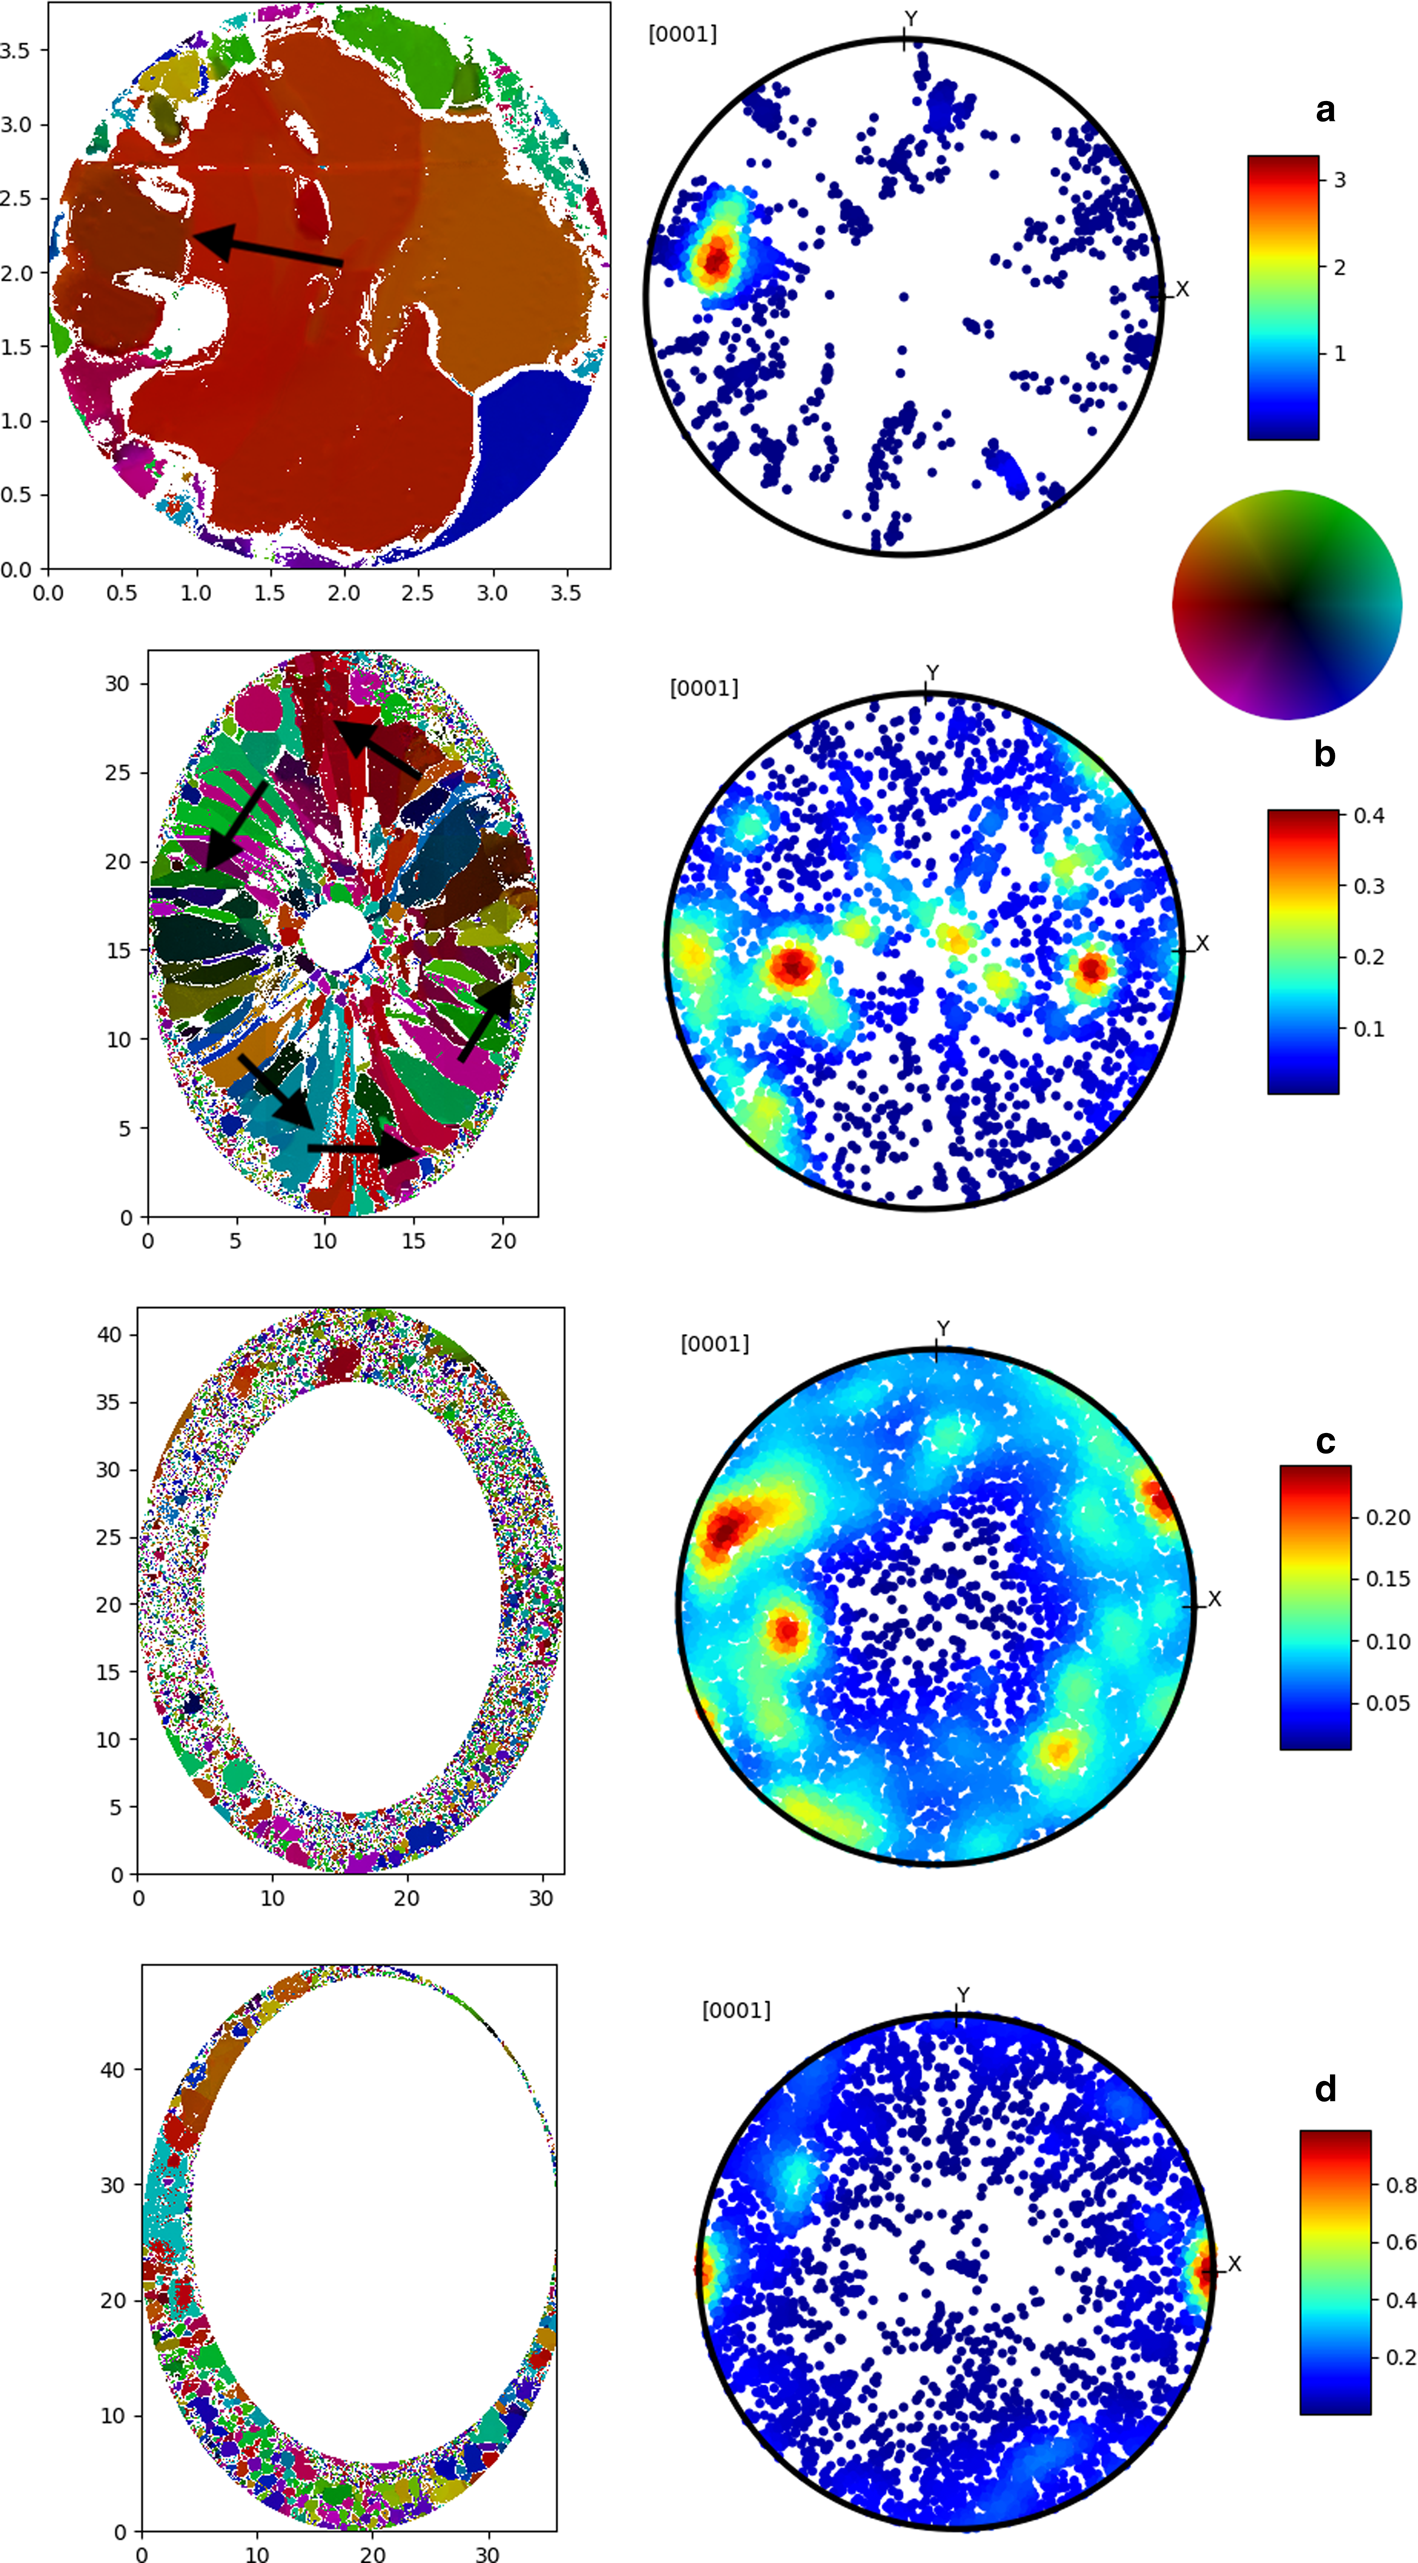
Fig. 5. Extracted microstructures of the layers observed in the French hailstone F1 with the corresponding pole figures. Core layer (top) to external layer (bottom). Black arrows sketch the orientation of a few selected c-axes to help with the analyses. The scale of the orientation color-coded map is in millimeter. The color code is provided by the color wheel.
The first noticeable layer (Fig. 5b) is composed of large grains elongated in the radial direction, which is the assumed growth direction (Knight and Knight, Reference Knight and Knight2005). A close look at the intersection between the core and this layer in Figure 2 reveals that this layer starts from a fined-grained area, and a porous area with large elongated pores is observed at the transition. In this coarse-grained layer, the texture is anisotropic, with c-axes oriented preferentially in a girdle perpendicular to the thin section plane. The analysis of several individual grain orientations indicates that most of them have their c-axis oriented perpendicular to their growth direction (or their long axis), as denoted by the black arrows in Figure 5.
The second layer (Fig. 5c) is a fine-grained layer that corresponds to the opaque, porous layer of Figure 1. This layer also has girdle-type c-axis distribution, with c-axes preferentially aligned close to the plane of the thin section. The slight misalignment could be due to the fact that the thin section was not cut exactly through the center of the hailstone. The large number of small grains, many of them too small to be oriented, prevent us from deciphering the orientation of the c-axes relative to the growth direction. The last layer (Fig. 5d) is composed of large, more equiaxed grains, also characterized by a girdle-type c-axis distribution. In this layer, some of the large grains have their c-axes oriented in the growth direction, and some are oriented perpendicular to this direction. No clear trend can be extracted owing to the limited number of grains in the layer.
The second hailstone used as an illustration is the German hailstone G1 (Fig. 2). One core and two individual layers could be clearly distinguished (Fig. 6). The last layer, being too complex, will not be commented here. The core (Fig. 6a) is composed of many small equiaxed grains (about a hundred micrometers in diameter). Such a microstructure would be in favor of a high porosity graupel embryo. Both the first and second layers (Figs 6b, c) are composed of radially aligned elongated grains, but grains are smaller in the second layer. The three parts (core and layers) show a distribution of c-axes characterized by a girdle oriented in the plane of the thin section. Colors in the microstructure images of the two external layers show a remarkable match with the color distribution of the color wheel, which highlights the radial orientations of the c-axes.

Fig. 6. Extracted microstructures of the layers observed in the German hailstone G1 with the corresponding pole figures. Core layer (top) to external layer (bottom). Black arrows sketch the orientations of a few selected c-axes to help with the analyses. The scale of the orientation color-coded map is in millimeter. The color code is provided by the color wheel.
Discussion
In the following, we will discuss our observations in light of the knowledge of the relationship between growth mechanisms and resulting textures and microstructures in lake ice. Such a choice will later be discussed regarding the hypotheses of wet growth mechanisms. There are two types of lake ice, termed S1 and S2, each with their own growth mechanism.
In terms of texture, S1 ice has its c-axes preferentially oriented in the direction of growth, while S2 ice is characterized by c-axes oriented in the plane perpendicular to the growth direction. In terms of microstructure, both types mostly show grains elongated in the direction of growth, known as columnar ice. Michel and Ramseier (Reference Michel and Ramseier1971) classified these two types of ice based on the departing point of their growth, called the ‘primary’ layer, that acts as seed. The classification provides four types of primary layers. One with seed-controlled c-axes orientations, resulting in S1-type ice, and the other three forming S2-type ice, owing to growth-controlled c-axis orientations. In order to induce the growth of S1 columnar ice, the primary or seed layer has to form slowly on still water, in such a way that grains, all with vertical c-axes, are covering the surface. On the contrary, the primary (seed) layers that lead to S2 ice formation are characterized by randomly oriented small grains, that result either from falling snow, or from an agitated surface. S1-type ice can therefore only grow if grains with c-axes oriented in the growth direction are present at the onset of growth, and under conditions quiet enough to prevent subsequent perturbation of the growth front.
All hailstones studied here have in common that they are composed of concentric layers with different grain size, morphology and texture. Our high-resolution measurements of c-axis orientations and microstructures reveal two specific textures. The first type is represented by the F1 hailstone, Figure 5 (see also Figs 9 and 10 in the Appendix for a similar hailstone F4). It includes samples composed of a nearly single-crystalline core, surrounded by a layer with large elongated grains with c-axes oriented tangentially, perpendicular to the growth direction. These specific crystalline orientations and morphology are comparable to the S2-type lake ice described before. The c-axis orientations would result, similarly to S2 ice, from a selective growth process, known as competitive growth or survival of the fastest (Bons and Bons, Reference Bons and Bons2003) also observed in icicles extracted from frozen ice falls (Montagnat and others, Reference Montagnat2010). Layers similar to the second layer of hailstone F1 (Fig. 5c) are commonly observed is the hailstones studied here. It is composed of fine grains with c-axes oriented with a relative isotropy in the thin section plane. A closer look at a few individual grains shows that both radial and tangential orientations are present (not shown here). Based on the grain size observation, we may assume that this layer is the result of the rapid freezing on the hailstone surface of supercooled droplets present in the cloud, very likely under dry conditions. Our texture observations seem to show that grain orientations present in this fine-grained layer could have impacted the crystalline orientations of the following layer by playing the role of seeds. Indeed the last layer shows large grains with some c-axes oriented along the growth direction, as observed in the G1 hailstone.
The second type of hailstone, G1, Figure 6 (see also Figs 7, 8 in the Appendix for a similar hailstone F3) also presents several layers but with another arrangement. The large elongated grains are characterized by c-axes oriented in the direction of growth. Contrary to the F1-type hailstone, the microstructure of the core is composed of small grains. From this core, the growth process in the subsequent layer seems to have favored a specific texture with c-axes oriented radially along the growth direction. Such a specific texture, that is not favored by growth, can be compared to the one observed in S1-type lake ice described before and that was shown to result from an oriented seed-based growth, under still conditions.
Finally, the French F3 hailstone (see Figs 7, 8 in the Appendix) is an interesting illustration of the complexity of the layer formation. The core is composed of a limited number of grains, with one main orientation. But this core is surrounded by a large layer of very fine grains. This layer seems to play the role of seed for the subsequent layers. This latter showing an S1-type texture, with radial c-axes. In turn, once interrupted in their growth process, the resulting rather large grains give way to a layer with an S2-type texture.
Crystal growth during hailstone formation could therefore follow mechanisms similar to those well documented for S1 and S2 lake ices. The conditions necessary to meet S1-type ice (c-axes oriented in the growth direction already present in the seed, and still growth conditions) seem to be satisfied in the G1-type hailstone within which the girdle-type texture observed in the fine-grained core (very likely resulting from a low porosity graupel embryo) provides the necessary seed orientations for the growth of grains with c-axes in the radial direction. The large dimension of these radially oriented elongated grains, and the low porosity (transparent ice), must result from relatively undisturbed and slow growth conditions (Knight and Knight, Reference Knight and Knight2005).
On the contrary, these conditions do not seem to apply to hailstones similar to F1 since the core is formed of a limited number of crystals with similar orientations (very likely resulting, in this case, from a freezing droplet embryo). Among all hailstones studied here (see also the Appendix), those with an S2-type texture had cores containing only a few large grains.
Spongy wet growth has been identified as a relevant mechanism for the formation of large hailstones for a long time (see for instance the pioneer work by List, Reference List1960a, Reference List1960b, Knight and Knight, Reference Knight and Knight1968). More recently, List (Reference List2014) and Phillips and others (Reference Phillips, Khain, Benmoshe and Ilotoviz2014) have suggested convincing modeling approaches that help to reinforce the likelihood of such a mechanism operating. During wet spongy growth, the hailstone is surrounded (partly or completely) by a liquid water layer resulting from its interaction with droplets in the cloud. The analysis performed in our study is therefore compatible with a wet and maybe spongy growth configuration, as the presence of water in contact with the growing ice surface is required. This analysis is not relevant for dry growth conditions that results in very fine-grained ice layers.
In their pioneer work, Knight and Knight (Reference Knight and Knight1968) aimed at correlating the likelihood of spongy growth with the characteristics of c-axis preferred orientations. The authors measured c-axis orientations by means of etching on the largest crystals from various natural large hailstones. Based on the hypothesis that hailstones could result from a spongy growth or not, the authors suggested that spongy hailstones were characterized by large elongated grains with a tangential c-axis preferred orientations, while large elongated grains in non-spongy hailstones would show more radial c-axis orientations. Knight and Knight (Reference Knight and Knight1968) concluded that, based on samples from five different storms, natural hailstones were likely not resulting from a spongy growth. Thanks to the high resolution of the crystallographic orientation measurements performed here we are able to provide a more accurate picture. Both radial c-axes and c-axes perpendicular to the growth direction are observed in individual hailstones (e.g. type F1, Fig. 5), and texture is therefore not an unequivocal indicator for spongy growth, unless various growth processes can occur during the formation of a single large hailstone. Our observations therefore highlight that, in order to complement recent studies on large hailstone formation (List, Reference List2014; Phillips and others, Reference Phillips, Khain, Benmoshe and Ilotoviz2014; Ilotoviz and others, Reference Ilotoviz, Khain, Benmoshe, Phillips and Ryzhkov2016), crystallographic orientation characterizations by means of high-resolution c-axes measurements are an interesting and potential useful additional tool.
Mechanical behavior of hailstones is of interest for predicting, and preventing, damage caused by hail impact. Hail impact occurs at relatively high strain rate, therefore in the dynamic regime (strain rate above ~10 s−1). Under these conditions, as mentioned in the Introduction, no study exists that takes into account microstructure and texture as factors that influence the mechanical response. Under quasi-static conditions, many studies exist, and show a limited effect of grain size on fracture toughness, with variations ranging from ~70 kPa m1/2 for 9 mm grain size to ~90 kPa m1/2 for 2 mm grain size, and no clear effect of texture (see Schulson and Duval, Reference Schulson and Duval2009, for a review). On the contrary, porosity does impact the fracture toughness under quasi-static conditions, with a decrease of ~25% when the porosity increases from 0 to ~15 vol% in fresh granular ice (Smith and others, Reference Smith, Schulson and Schulson1990). In the dynamic loading range (strain rates between 20 and 130 s−1), Georges and others (Reference Georges, Saletti, Montagnat, Forquin and Hagenmuller2021) showed a strong effect of porosity on the velocity-dependent tensile strength, which decreases by ~25% when the porosity increases from 1 to ~10 vol%. Few of the ice-impact studies performed so far considered the microstructure and texture of the laboratory grown samples, which may explain the highly variable reported strength measurements (see e.g. Shazly and others, Reference Shazly, Prakash and Lerch2009; Combescure and others, Reference Combescure, Chuzel-Marmot and Fabis2011; Tippmann and others, Reference Tippmann, Kim and Rhymer2013). We therefore suggest to pay more attention to grain sizes and porosity in order to design statistical microstructures as close as possible to the hailstone microstructures as characterized here. In addition, the role to texture on the mechanical strength under dynamic conditions relevant for hail impact remains to be studied. It is only under these conditions that the modeling of hail impact on structures will be efficient (see e.g. Meyers, Reference Meyers1994; Erzar and Forquin, Reference Erzar and Forquin2010).
Conclusions
This paper presented high-resolution characterizations of the microstructure and texture (c-axis orientations) of several large hailstones originating from two storms, one that took place in France in 2015, and the other one in Germany in 2013. High spatial and angular resolution observations of textures were made possible by thin section analyses with an Automatic Ice Texture Analyser. We observed strong microstructure similarities between all hailstones studied, with a quasi-spherical layered structure, in which layers of small equiaxed grains alternate with layers of large elongated (columnar) grains. Despite these strong similarities, we recognized two main types of hailstones, each with a specific crystallographic texture within successive layers. One type is mostly made of layers with c-axes oriented radially, in the direction of the large grain columns. The other type presents some layers with c-axis orientations perpendicular to the radial (and growth) direction. These different types seem to result from the specific properties of the core or the inner contiguous layer (in terms of orientation and number of grains), and are compared to the extensively studied S1 and S2 types of lake ice, providing insight into their formation history.
So far very few studies exist on the effect of texture and microstructures on the brittle strength, to predict their effect on the dynamic response of hailstone ice and resulting damage would be speculative. This study reveals the full microstructure complexity, including layered structure, crystal shapes, orientations and porosity within hailstones that should be taken into account to correctly extrapolate laboratory experiments to natural conditions.
Data availability
Data are available on Zenodo database under the reference (Montagnat and others, Reference Montagnat2020) (https://doi.org/10.5281/zenodo.3938956). Data treatment can be performed by using the freely accessible Python toolbox developed by Thomas Chauve (https://github.com/ThomasChauve/aita).
Acknowledgments
The authors acknowledge association ANELFA and volunteers who collected the French hailstones in the southwest of France. A. Burr is greatly acknowledged for his help during tomography measurements, and T. Chauve for his support on the Python tools he developed.
Author contributions
MM wrote the article and organized the interactions between co-authors. MM made some of the texture measurements and analyses. MB wrote the first draft of the article and made the main measurements and analyses (including microCT). AP participated in the writing and in the measurements and analyses of the microCT data. PB participated in the writing and analyses of the data. PB and CB provided the German hailstones. PD and PH provided the French hailstones and provided some financial support. We acknowledge support by the Open Access Publishing Fund of the University of Tübingen.
Financial support
Support was provided by CNRS INSIS and INSU institutes. The French Direction Générale de l'Armement (DGA) supported this research through the framework of project RAPID 142906128. Labex OSUG@2020 partly supported this study in the frame of the project ANR10Labex56. We acknowledge support by the Open Access Publishing Fund of the University of Tübingen.
Conflict of interest
The authors declare that the research was conducted in the absence of any commercial or financial relationships that could be construed as a potential conflict of interest.
Appendix A
Figures 7 and 8 show the microstructure of a French hailstone called F3. This ‘star geometry’ is a typical geometry for wet growth (Knight and Knight, Reference Knight and Knight2005). The sample size was estimated by making the assumption of an oblate spheroidal shape. The large axis is ~6.4 cm, the medium axis is ~5.5 cm and the little axis is ~4.5 cm.

Fig. 7. Orientation color-coded microstructure of the French hailstone F3 and the corresponding pole figure. For each hailstone: Left: orientation color-coded image obtained after a filtering with QF set to 75. White areas are excluded for further analyses. The orientation color-code is given by the color wheel on the bottom left of the images (lower-hemisphere, equal area stereographic projection). Scale is mm. Right: c-axis orientations plotted on a pole figure. The color-code corresponds to the density of pixels. The (x, y) plane is the plane of the thin section.
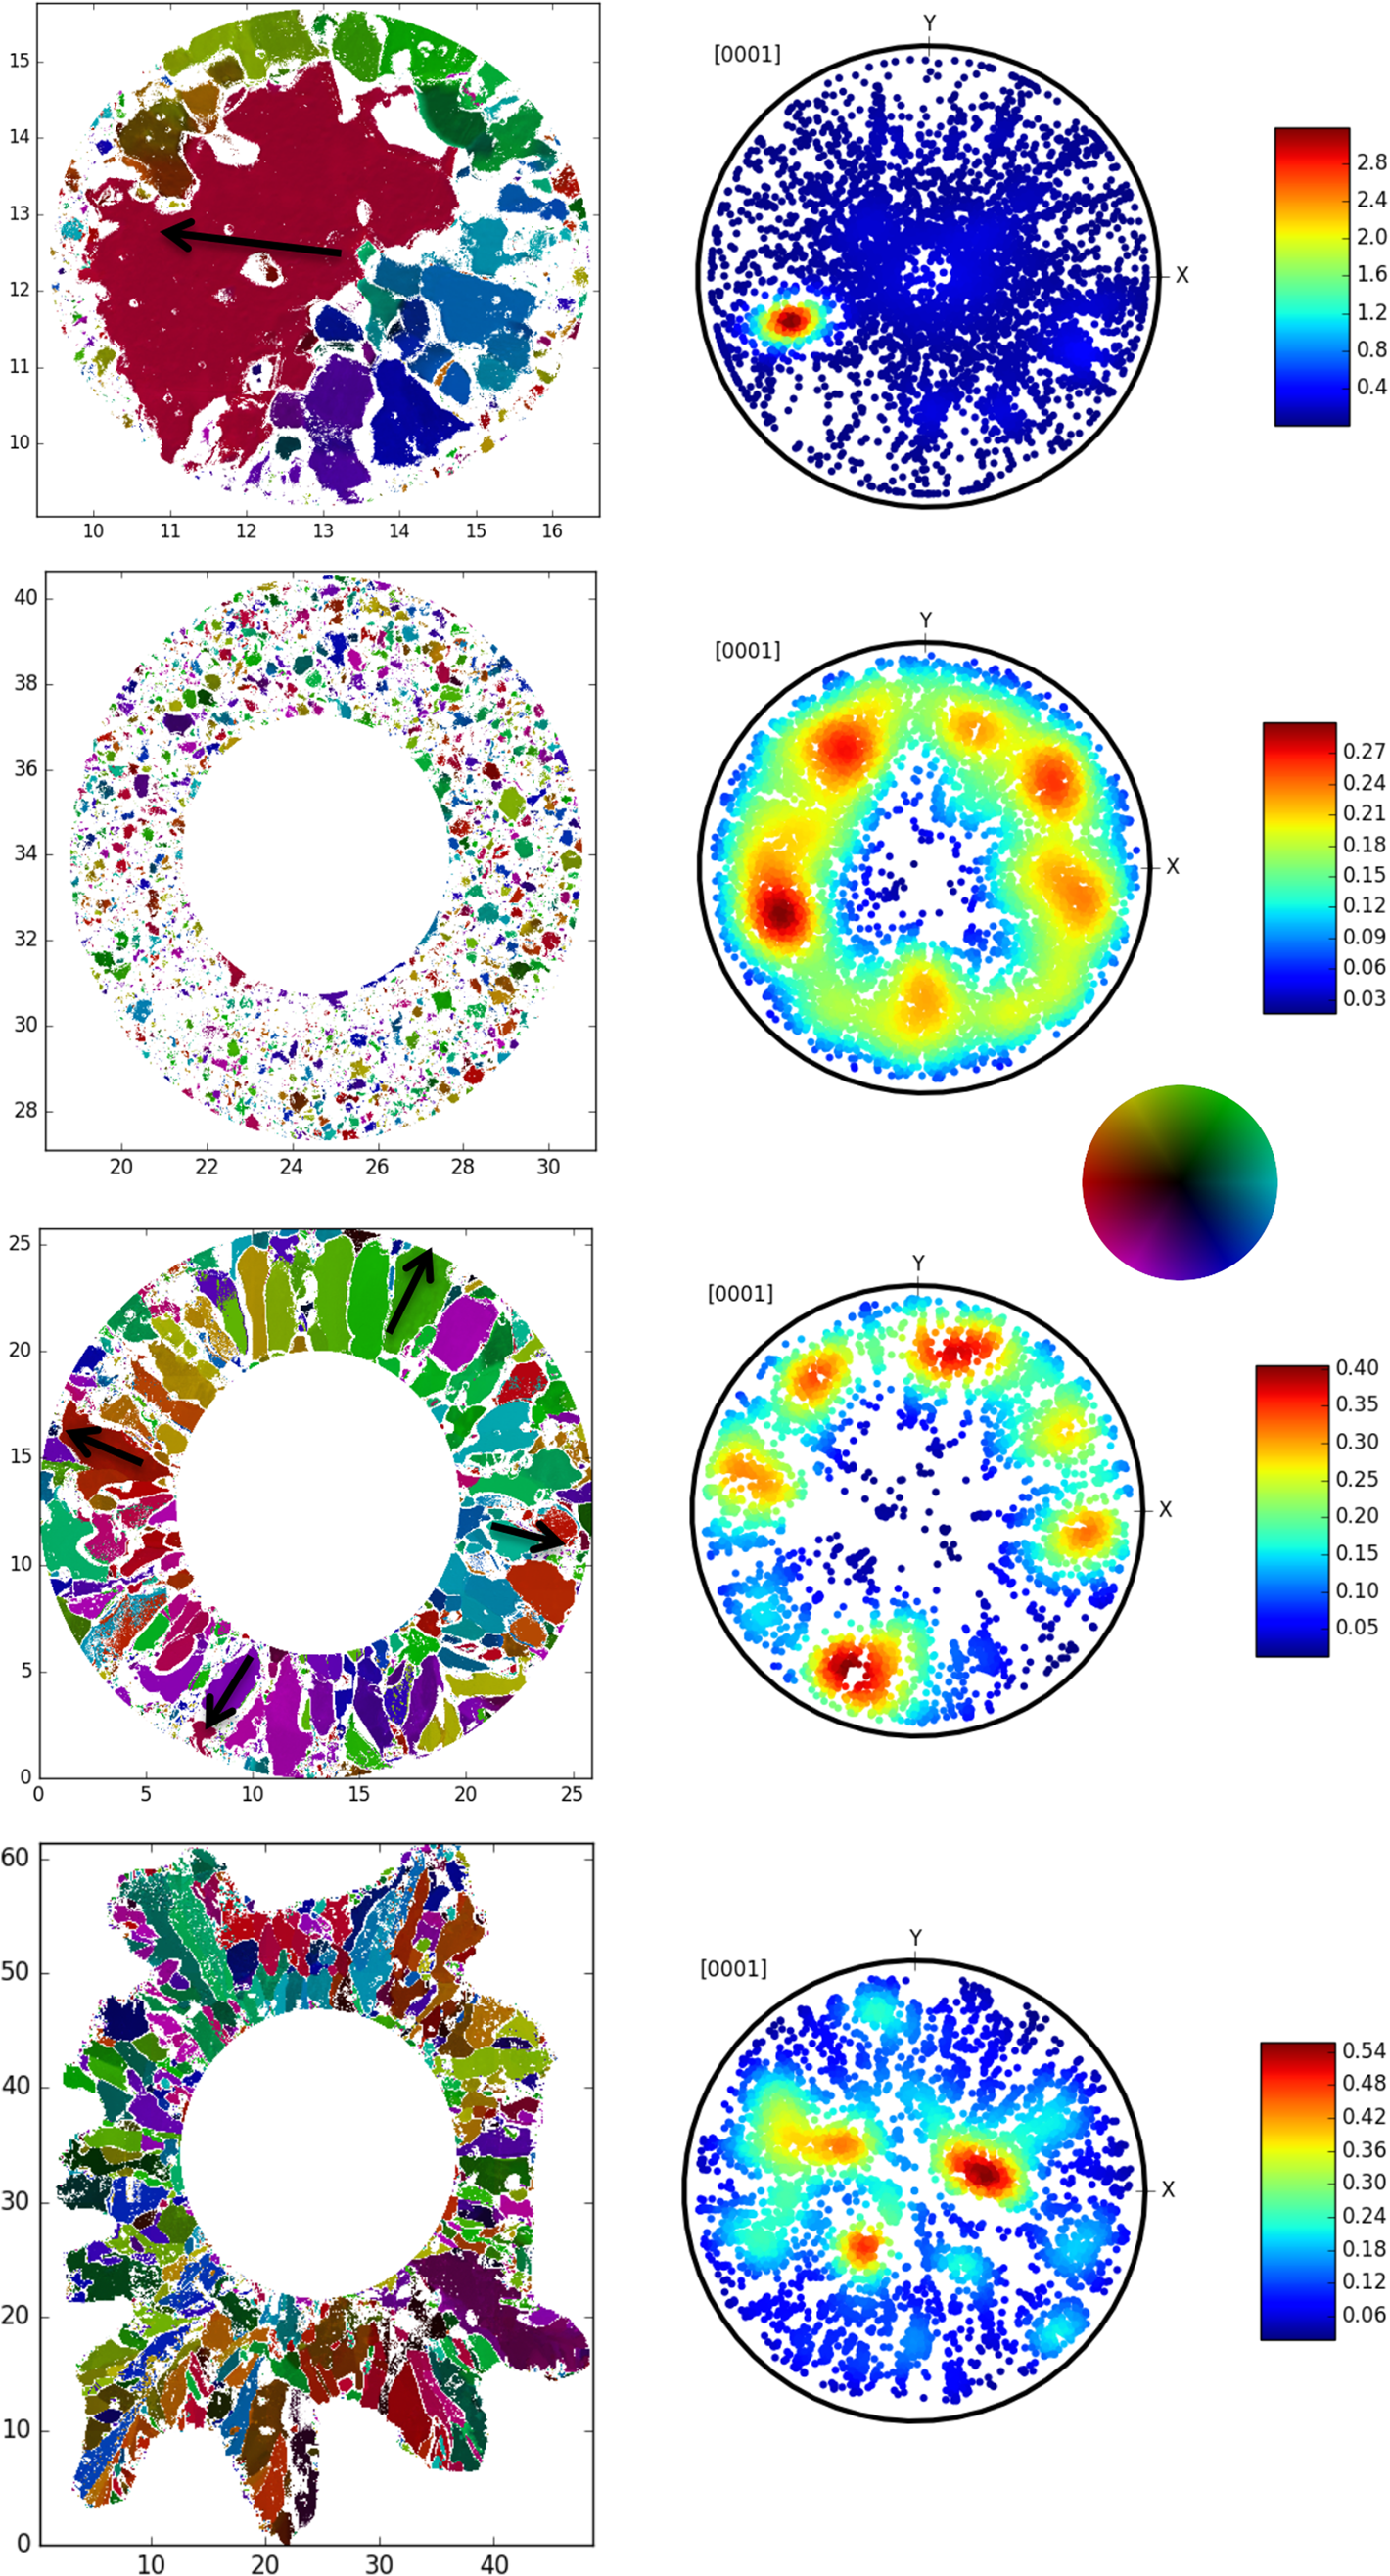
Fig. 8. Orientation color-coded representation of the different layers of the French hailstone F3 and corresponding pole figures. See Figure 7 for color-code and scale explanation.
The latest French hailstone studied, called F4, is relatively spherical with a diameter of ~3.5 cm (Fig. 9). The sample is opaque which testifies of the presence of a rather homogeneous porosity distributed in the hailstone. Its microstructure and the corresponding pole figure are presented in Figures 9 and 10.

Fig. 9. Orientation color-coded microstructure of the French hailstone F4 and the corresponding pole figure. See Figure 7 for color-code and scale explanation.

Fig. 10. Orientation color-coded representation of the different layers of the French hailstone F4 and corresponding pole figures. See Figure 7 for color-code and scale explanation.
The German hailstone called G2 is relatively complex, and the different layers are uneasy to distinguish. However, we can observe four different layers including first an ex-centered embryo with relatively large grains, a second layer with relative large grains (~1 mm in diameter), a third layer with small equiaxed grains and a fourth layer with ellipsoidal grains elongated in the direction of growth. The global texture of this hailstone is of girdle-type, with most c-axis orientations in the radial direction (Figs 11, 12).

Fig. 11. Orientation color-coded microstructure of the German hailstone G2 and pole figure. See Figure 7 for color-code and scale explanation.

Fig. 12. Orientation color-coded representation of the different layers of the German hailstone G2 and corresponding pole figures. See Figure 7 for color-code and scale explanation.
The last studied hailstone called G3 is a specific one where only two layers could be identified (Fig. 13). One large layer with homogeneous equiaxed grains and a second small layer with elongated grains. The first layer presents pole figure with a ‘ring-like’ texture, and the second one presents a preferential orientation with two main poles.

Fig. 13. Orientation color-coded representation of the layers of the German hailstone G3 and corresponding pole figures. See Figure 7 for color-code and scale explanation.


 Open access