Introduction
Although Antarctic ice cores have provided a wealth of paleoclimate data for the past 200 000 years, with the key advantage that ice cores are continuous paleoclimate recorders, little attention has been given as yet to the Holocene interval. During the past 10 000 years, climate proxies recorded in Antarctic ice all have fairly constant levels, with fluctuations typically one order of magnitude smaller than Pleistocene-Holocene changes. This is true for trace gases trapped in air bubbles, aerosols and dust content as well as for the concentration of stable isotopes D and 18O in ice.
The primary objective of this paper is to discuss Holocene temperature changes from the isotope record of several ice cores. D/H and 18O/16O ratios in ice are linearly related to local temperature and this makes it possible to reconstruct the temperature on a quantitative basis. However, the climatic signal contained in isotope data is embedded in noise related to snow-deposition processes. We need to separate the climatic information from the noise. We show in the following that only fluctuations of duration longer than ≈500 years are relevant for climate.
The ice cores we examined fall within two categories (Table 1: Fig. 1). "Deep ice cores" were drilled on the Antarctic plateau, where both the annual accumulation and ice motion are small. Such cores give access to very long climate records essentially exempt from ice-flow distortion. But, within the Holocene, deep ice cores offer only a limited time resolution. "Coastal ice cores" drilled along the margins of the ice sheet have greater accumulation rates and thus better time resolution. However, the regional ice flow is relatively fast and strongly affects the isotope profiles, as ice measured in the cores originates from upstream. Coastal ice cores integrate past variations in climate over an extended area.
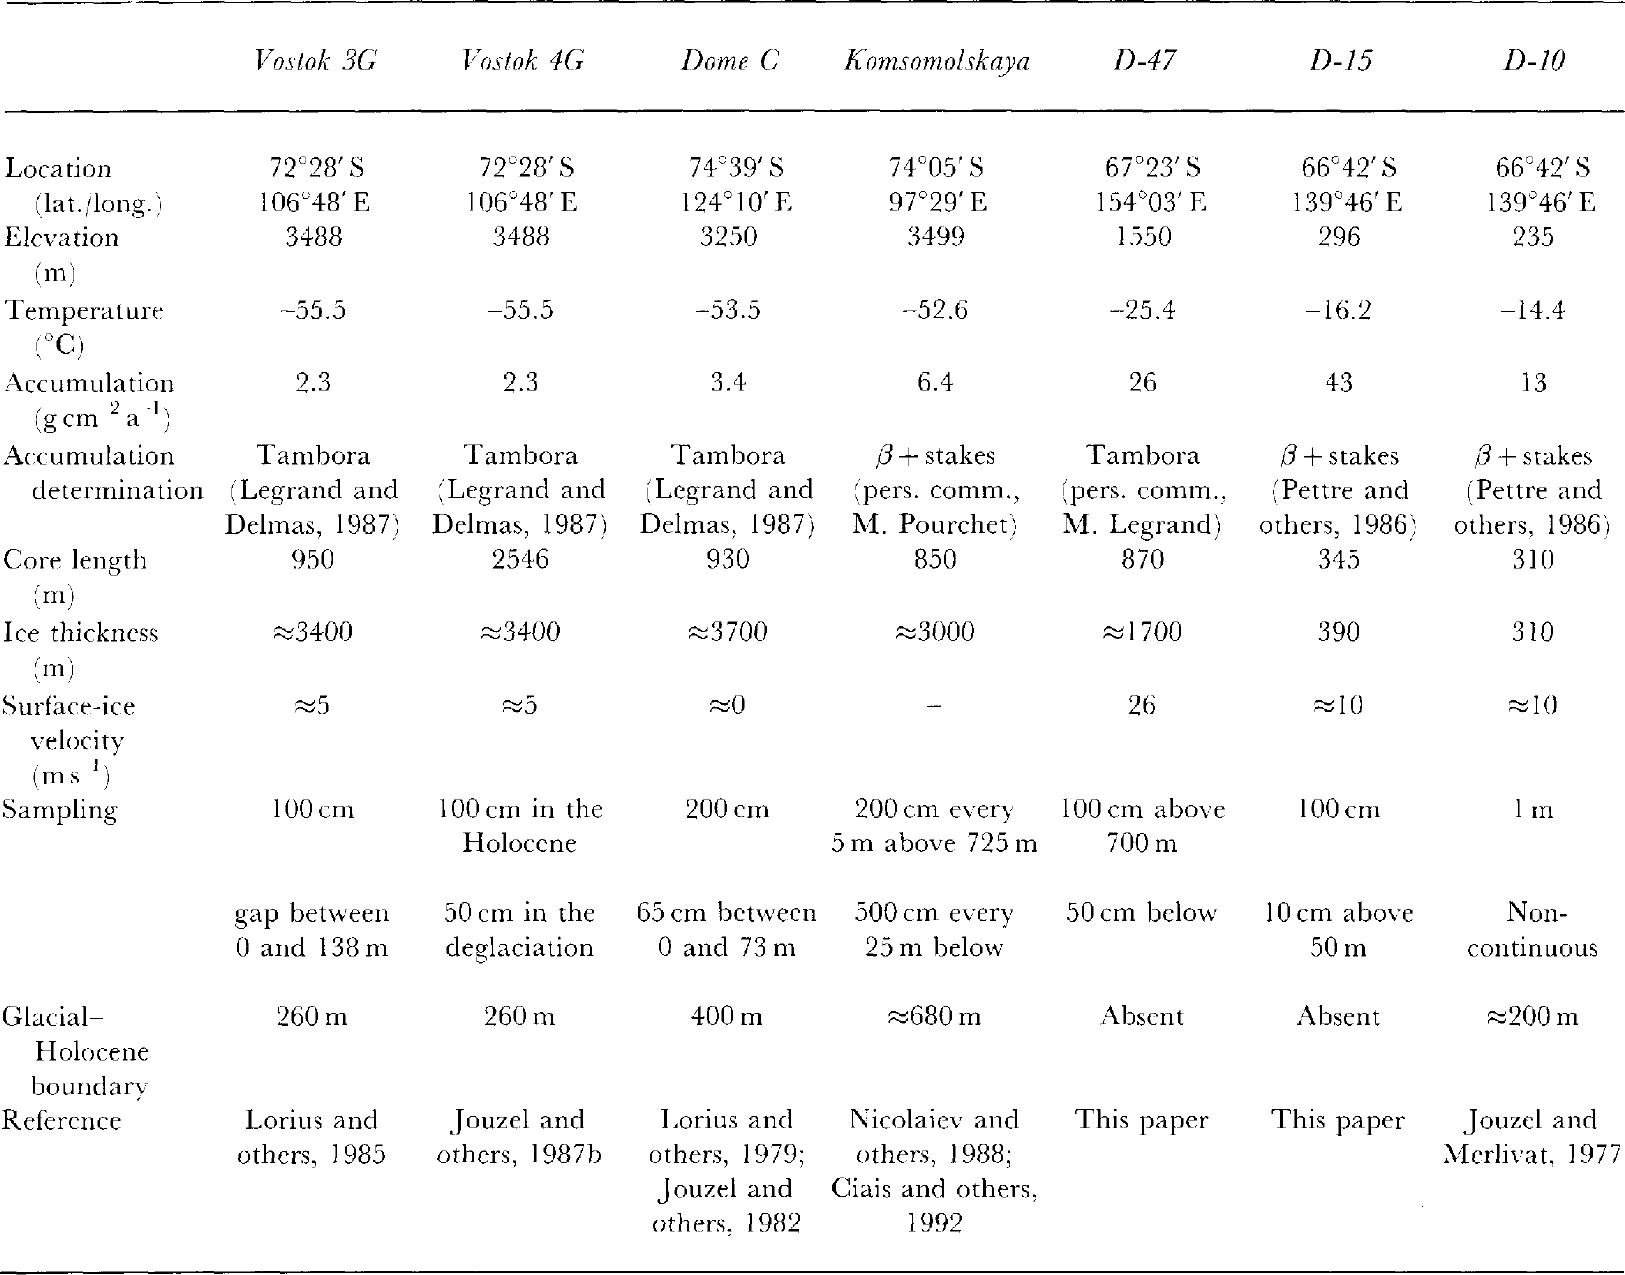
The dating of the deep ice cores from Vostok and Dome C has been based on ice-flow models over the last climatic cycle. For the Holocene, the dating needs to be examined in detail. Because Holocene ice represents a minor fraction of the total ice-sheet thickness, its chronology is dominated by accumulation rates, while such variables as bedrock topography or ice rheology are unimportant. The dating of coastal ice cores can also be addressed by models, which offer the advantage of being able to deconvolute the flow-related component from the climate-related component in the isotope profiles. Complications arise, however, at sites located on the ice-sheet margins because several distinct boundary conditions affect the ice dynamics. With the exception of D-10 and D-15, each core presented in this study is dated separately and is independent from other paleoclimate records.
1. Isotope data
The isotope data of the deep and coastal ice cores are presented in Table 1 and Figure 2. Further information on the cores (drilling technique and core recovery) can be found in the references provided. The ice cores of D-47 and D-15, respectively, drilled in 1988 and 1983 by the French Polar Expeditions, are presented for the first time in this paper. The dating of these cores is discussed in section 2.2.
2. Ice-core chronology
2.1. Deep ice cores
Lack of seasonal variations in the isotope data at inland Antarctic sites
The snow deposition in Antarctica is much lower inland (≈5 g cm-2 year-1) than on the coast (≈l00 g cm-2 year-1) (Reference BromwichBromwich, 1988). Therefore, the surface relief (sastrugi) and scouring by wind may erase the annual isotope signal. In addition, vapor-phase diffusion of HDO and H2 18O in the firn smooths short-length isotope events (Reference Johnsen, Robin and deJohnsen, 1983; Reference Whillans and GrootesWhillans and Grootes, 1985). There is no seasonal variation in the isotopes (nor in other species recorded in ice) at Vostok, Dome C or Komsomolskaya. The dating of these cores cannot rely on annual layer counting.
Ice-flow models within the Holocene period
The chronology of the deep ice cores is established by ice-flow models. The one-dimensional model of Dome C only accounts for vertical thinning under a constant strain rate.
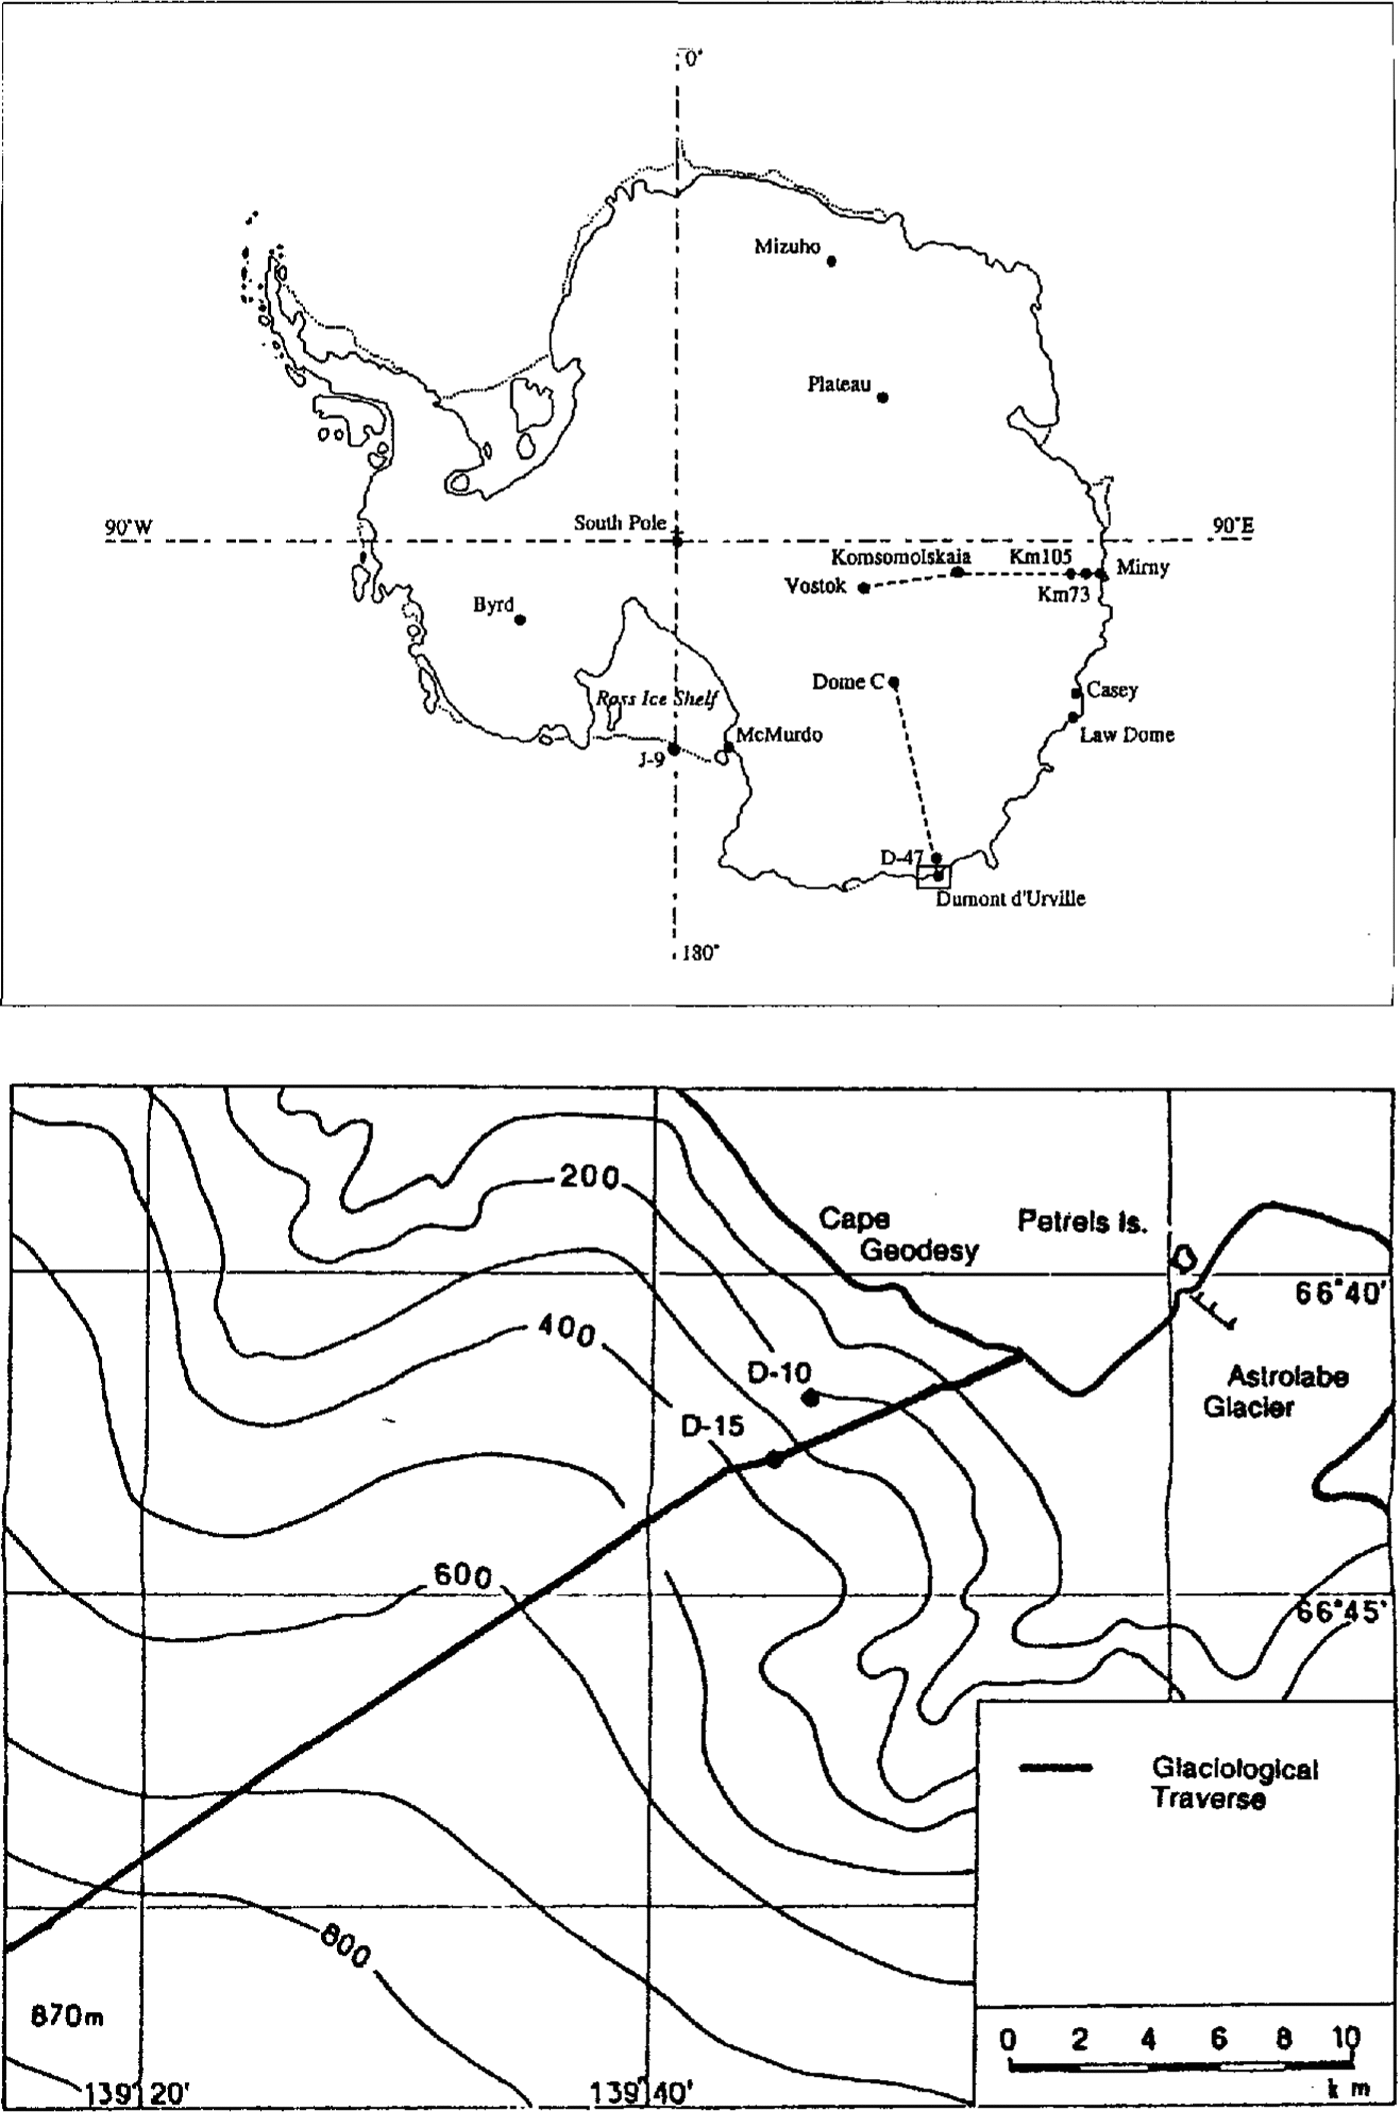
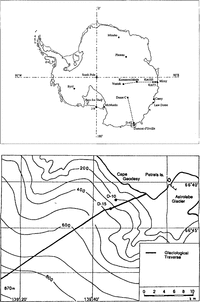
Fig. 1 Map of Antarctica with location of the drilling sites.
The two-dimensional model of Vostok accounts for horizontal flow (Reference LoriusLorius and others, 1985; Reference RitzRitz, 1992). At Dome C and Vostok, because of the slow motion and great thickness of the ice sheet, the dating of the Holocene ice depends essentially on the accumulation rate. Currently, it is assumed that the amount of water vapor available for precipitation is controlled by the inversion temperature (T) (Reference LliboutryLliboutry, 1965; Reference RobinRobin, 1977). The accumulation decreases during cold periods and increases during warm periods. A quantitative formulation of this argument is given by Equation (1) (Reference LoriusLorius and others, 1985):

b(z, t) = accumulation rate at depth z and time t,
Ps(T) = saturation water-vapor pressure.
Using Equation (1), Reference JouzelJouzel and others (1989) dated two 10Be peaks measured both on Dome C and Vostok at 35 000 years BP and revised the maximum age of Dome C by 5000 years. They reached the conclusion that the dating over the last climatic cycle of both cores was approximately correct and only needed minor adjustments. When it comes to the Holocene period, where a more precise dating is needed, the validity of Equation (1) becomes questionable. Indeed, ice-flow models based on Equation (1) have yielded an artificial lag of 1500 years for the Vostok record with respect to Dome C within the deglaciation (Reference CiaisCiais and others, 1992). Recently, the Vostok dating has been refined using new accumulation measurements on the flowline upstream from the drilling site (Reference JouzelJouzel and others, 1993). In this study, we use the new EGT (extended glaciological time-scale) for Vostok which reduces the lag with Dome C during the deglaciation to 500 years.
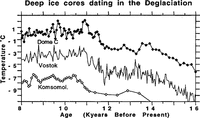
Lacking reliable accumulation data for 1991, the earlier dating of Komsomolskaya was arbitrarily correlated with Dome C (Reference CiaisCiais and others, 1992). We use now an accumulation of 6.54 g cm -2 year-1 provided by M. Pourchet (β technique) in a .Nye ice-flow model. The new Komsomolskaya chronology relates within 400 years to the chronology of Vostok (Fig. 3). The respective chronologies of Vostok, Dome C and Komsomolskaya are all in good agreement at the onset of the Holocene. Comparison of the δ D profiles suggests an age difference that does not exceed 300 years at 11000 years BP.
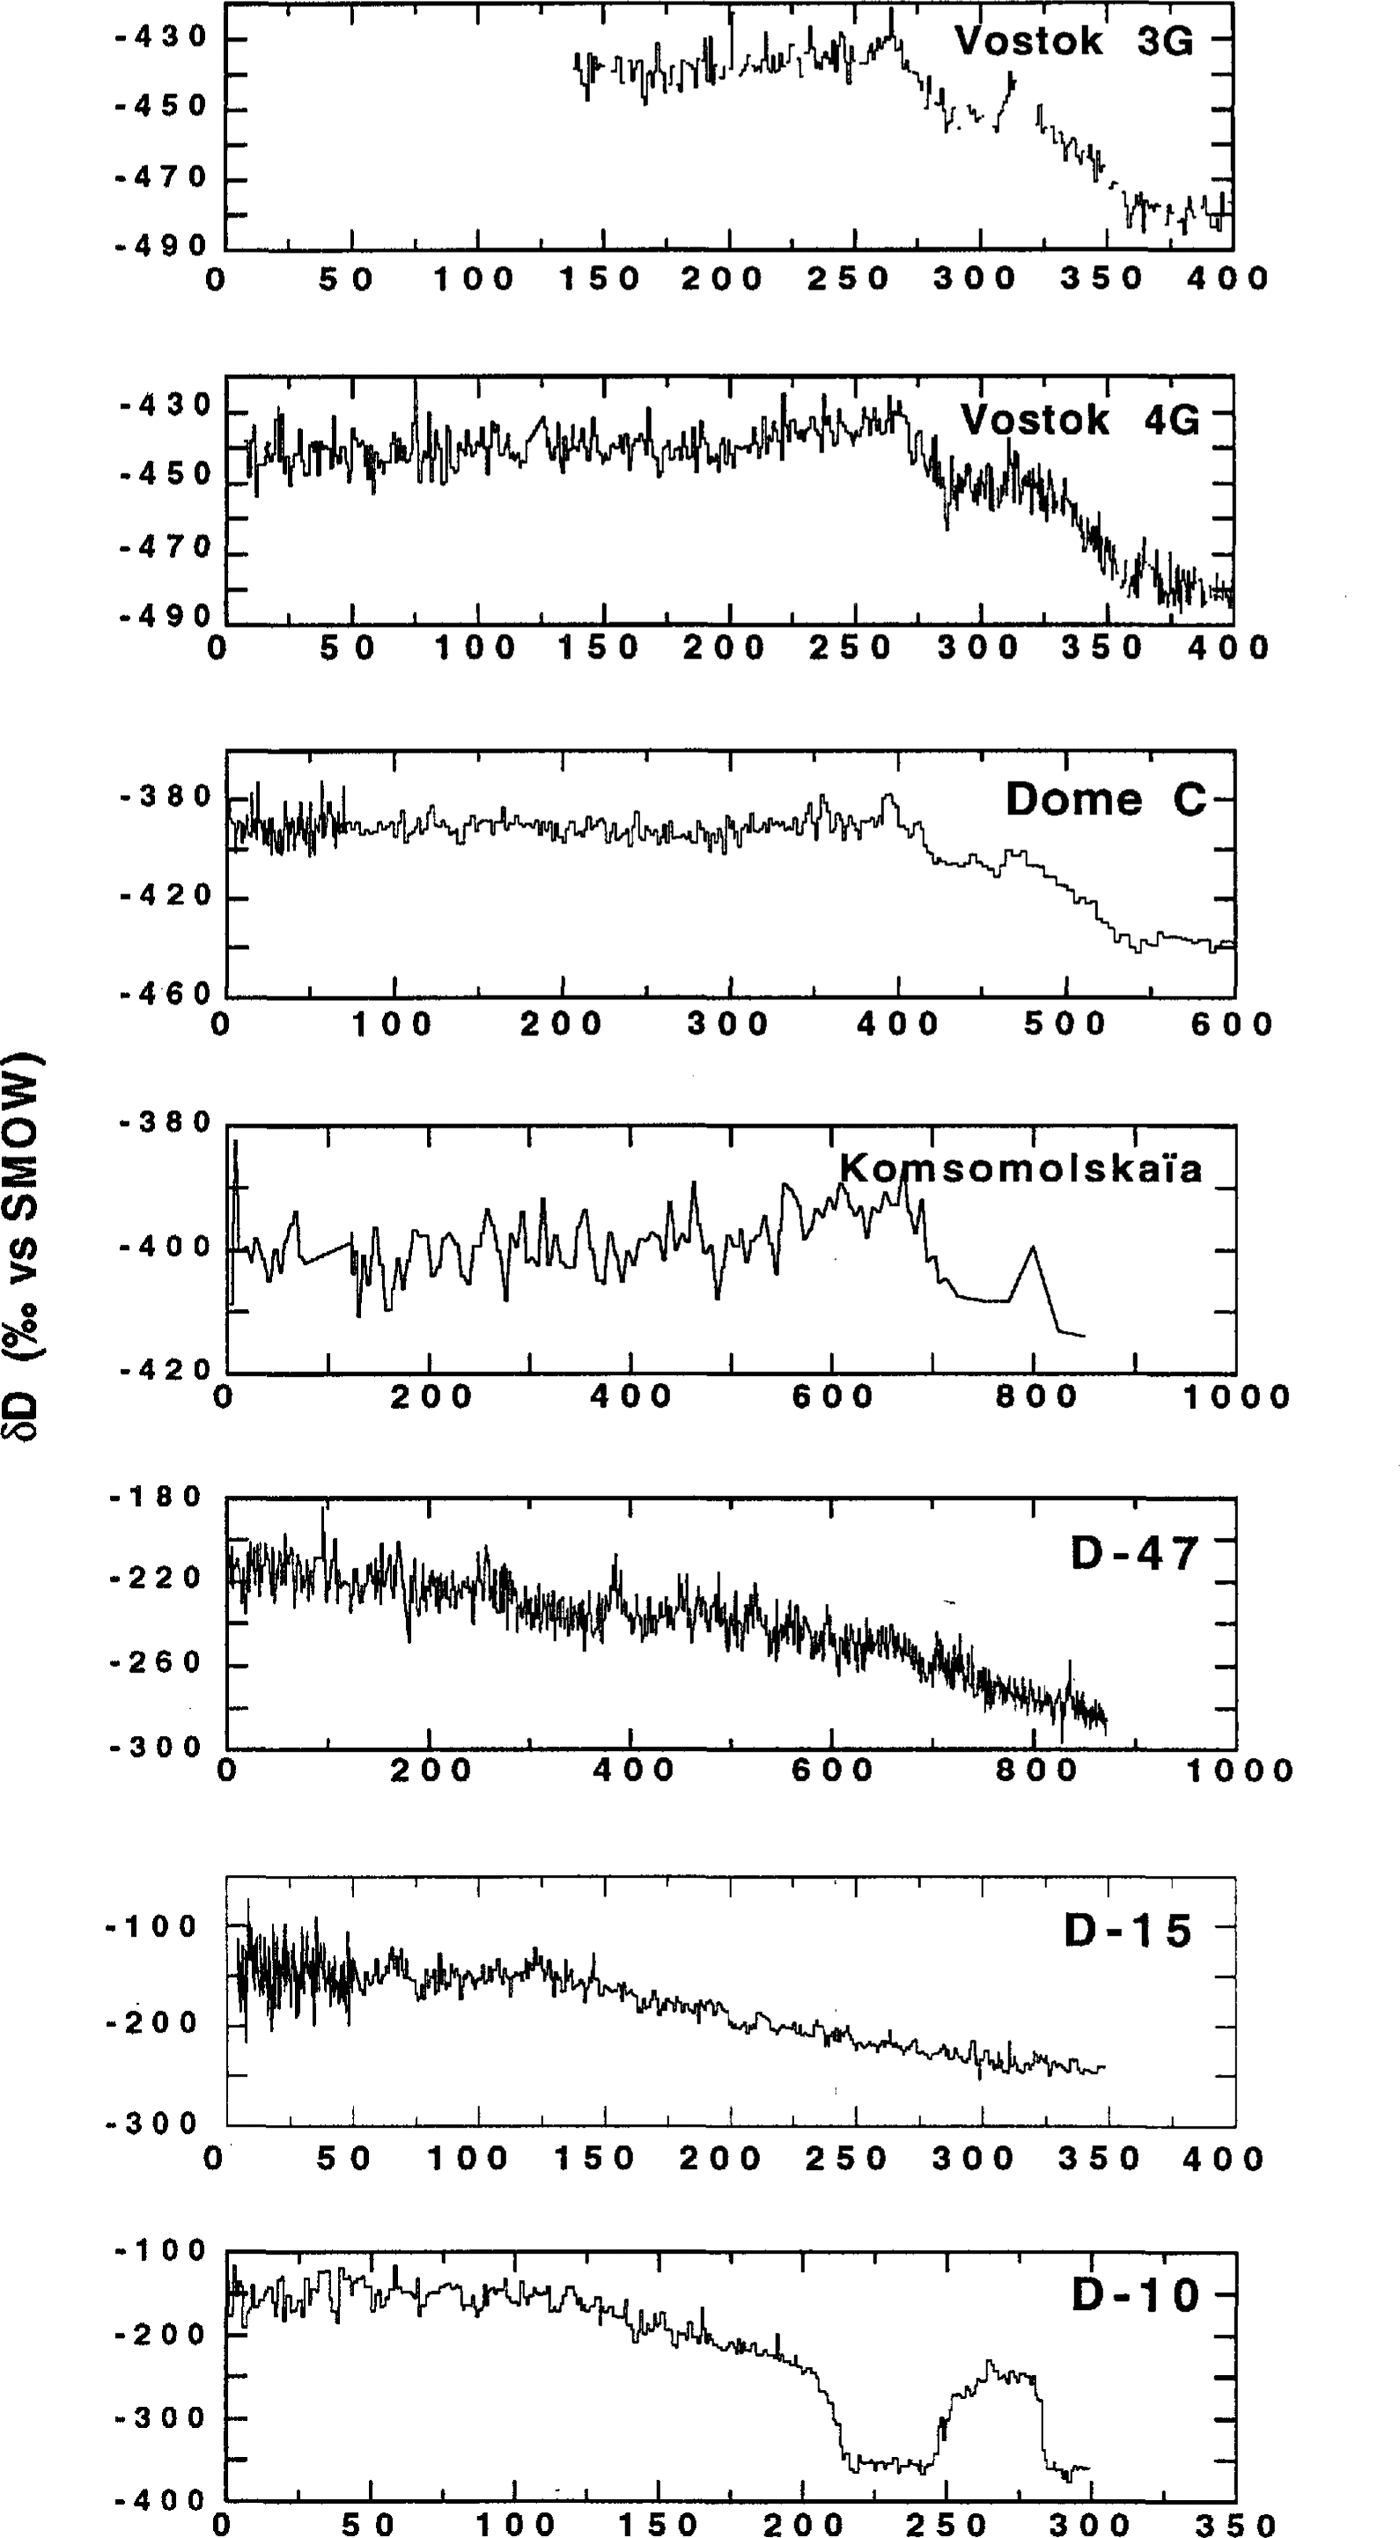
Fig. 2 Isotope profiles (vs depth) for seven Antarctic ice cores: coast ice cores are D-10, D-15 and D-47; deep ice cores are Vostok 3G and 4G, Dome C and Komsomolskaya. Note that only D-10 is drilled to the bedrock and shows the Glacial-Holocene climatic transition (the amplitude is more than three times higher than for Vostok or Dome C). Upper 400 m data are shown for Vostok and upper 600 m for Dome C.
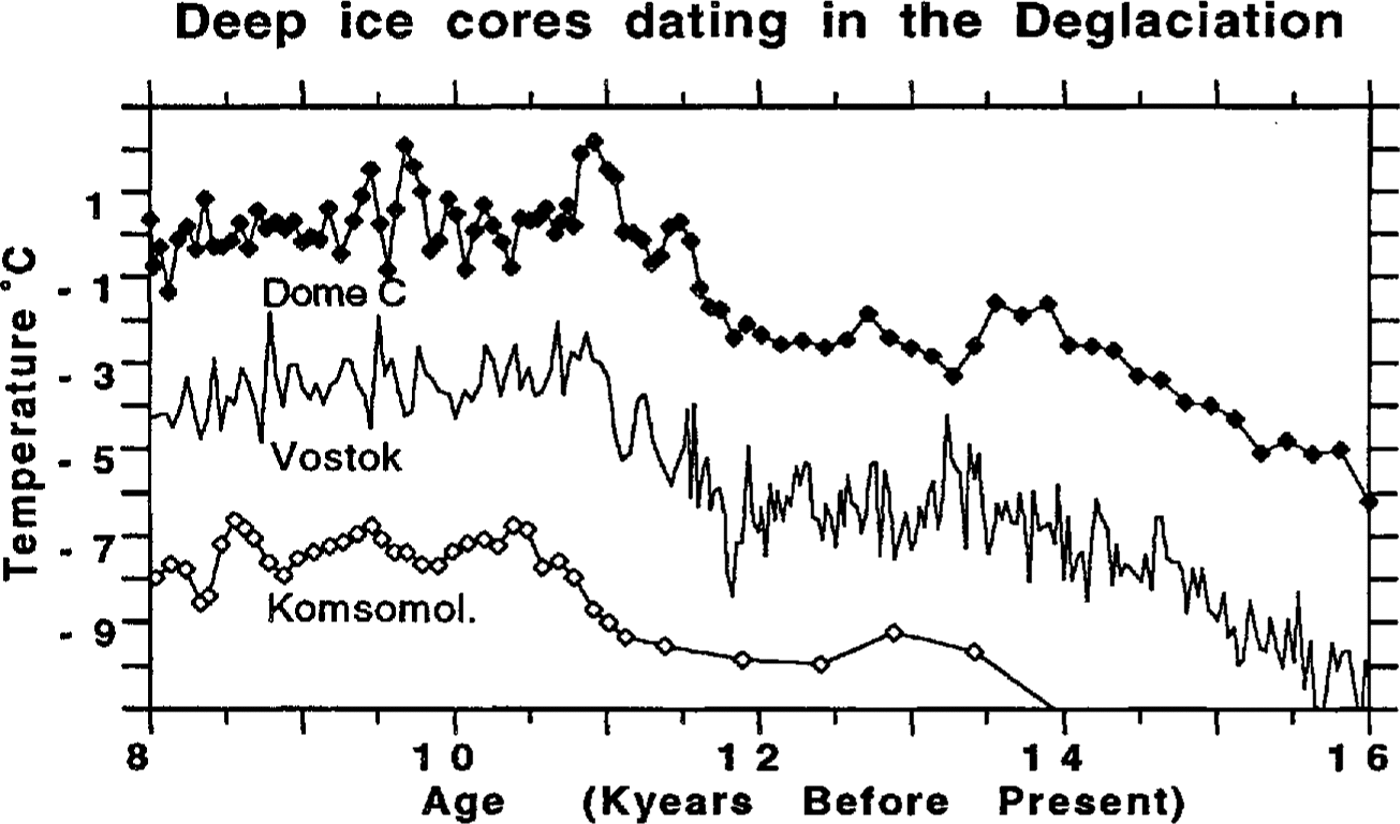
Fig. 3 Dome C, Vostok and Komsomolskaya isotope profiles between 8000 years nr and 18000 years BP. Each core is dated independently using a regional ice-flow modeling technique and modem accumulation-rate measurements (Table 1). Time-scale discrepancies do not exceed 500 years between the three profiles.
2.2. Coast ice cores
D-47: ice-flow model and seasonal variations in δ D
Dating of the D-47 ice core is complicated by the fast motion of the ice (decreasing trend of δ D with depth: shown in Figure 2. The absence of characteristic discontinuity in δ D shows that the core does not reach into the Pleistocene. The regional flow-boundary conditions are (1) the accumulation rate upstream of the core site, (2) the divergence of the flowlines, (3) the topography of the bedrock and of the ice-sheet surface, and (4) the ice rheology. We have adapted the two dimensional model for Vostok (Reference RitzRitz, 1992) to the flowline of D-47. Ice trajectories are back-calculated until the "origin" of the ice (upstream location where the ice was deposited) is determined. We obtain in that manner several age-Z curves that correspond to different assumptions for the boundary conditions. These curves can be very different. A detailed sensitivity study shows that boundary conditions (1) and (2) play the major role in the calculation of the age-Z curve (Reference CiaisCiais, 1991). This is probably because the ice of D-47 is distant enough from the bedrock for basal-flow complications not to occur. We used regional accumulations from the well-documented data set of β measurements by Reference Pettre, Pinglot, Pourchet and ReynaudPettre and others (1986). We estimated the regional flow divergence from the surface elevations (Reference Lorius, Rouillon and HellyLorius and others, 1967; Reference DrewryDrewry, 1983) and hypothesized no change in the divergence with depth.
Still, the uncertainty of the model boundary conditions yields age -Z curves that differ by almost a factor of 2 (Fig. 4). An appropriate constraint is raised by high-resolution δ D measurements on selected parts at discrete depths along the core (every 100 m). Each high-resolution δ D series is a 3 m long ice segment sampled every 2 cm. From the preserved isotopic cycles (seasonal variations), we calculated a mean annual-layer thickness using the maximum entropy spectral-analysis method (Reference JohnsenJohnsen, 1978). Annual-layer thicknesses are used to constrain ice-flow model calculations and therefore allow us to select the exact age-Z relationship with an error of approximately 10% (Fig. 4). The age of the D-47 ice core is determined as 7500 years BP.
D-15 and D-10: ice-flow model and stratigraphic correlation
At D-10 and D-15, the reduced thickness of the ice sheet makes the bedrock topography and the rheology as important as the accumulation and divergence in determining the chronology. Also, large variations in the ice thickness could have occurred during the Holocene. For D-10, we forced the age-Z calculated by our two-dimensional regional model to put the termination of the δ D discontinuity at 11 000 years BP (according to the Dome C profile). D-15 does not reach into the Glacial. At the bottom of the core, δ D (-245%0) is equal to the value observed for the onset of the Holocene at D-10. Because D-15 and D-10 are located 2 km apart and the present-day ice velocity is 10 m year-1, we dated D-15 by fixing the bottom of the core to the onset of the Holocene.
3. Isotope-temperature.transfer function
3.1. Isotope-temperature relationship
Relation between δ and T at present and in the past
In cold ice-sheet regions, the average δ of surface snow is a linear function of local temperature. A regression of the data collected in Antarctica gives a value of 6.04‰°C-1 for the δ D T gradient (Reference Lorius and MerlivatLorius and Merlivat, 1977; Reference Qin Dahe, Petit, Jouzel and StievenardQin Dahe and others, 1994). The observed decrease of δ with T in polar snowfall is due to the cumulative effect of condensation events that deplete the water vapor above the ice sheet in isotopes (Reference DansgaardDansgaard, 1964). The stability of the δ - T gradient in the past can be tested using general circulation models where water isotopes can be run under realistic climate-boundary conditions (Reference Joussaume, Jouzel and SadournyJoussaume and others, 1985; Reference Jouzel, Russell, Suozzo, Koster, White and BroeckerJouzel and others, 1987a). Reference Joussaume and JouzelJoussaume and Jouzel (1993) recently found that the δ -T gradient in Antarctica during the last glacial maximum was not very different from today. Dealing with stable climates during the Holocene, it is reasonable to use the observed present δ T gradient to reconstruct past temperatures. Complications arise in coastal regions where the δ -T relationship only prevails above 1000 m elevation (Reference Lorius and MerlivatLorius and Merlivat, 1977). D-47 is located above 1000 m and δ D along the core records temperature. For D-15 and D-10, one can sec in Figure 2 that only the ice from upstream regions above 1000m depth (now at a depth below 120m in D-15) shows a characteristic decrease of δ D with depth. After our dating of the core, surface ice for which δ D is a dubious proxy of temperature is no older than 700 years. In this study, we do not discuss the climate of the last millennium but the fluctuations during the last 10 000 years, and the core of D-15 is a reliable indicator of temperature over this time period.

Fig. 4. Ice-flow model time-scales calculated for the D-47 ice core under different accumulation rates parameterization. Accumulation scenarios are based on measurements made on the D-47 flowline by Reference Pettre, Pinglot, Pourchet and ReynaudPettre and others (1986) ("median" case), idem Plus standard deviation ("high" case), idem minus standard deviation ("low" case). Note the large sensitivity of the model to the accumulation-rate parameter. Vertical bars mark the isotopic constraints on the ages (see section 2.2)
Biases in isotope records
We examine three systematic biases of the temperature information contained in the isotopes. (1) Changes in ice thickness and ice flow cause a displacement of the origin of the ice which may affect the isotope record. Over central Antarctica, Holocene variations in the thickness of ice arc probably negligible (Vostok elevation did not change by more than 100 m over the last climatic cycle). Over coastal Antarctica, the ice-flow model we used to date D-47 was in agreement with the isotopic constraints on the dating only if elevation changes were less than 200 m (Reference CiaisCiais, 1991). At the edge of the ice sheet, the Holocene isotope records of D-15 and D-10 are certainly affected by changes in ice thickness (Reference Grootes and StuiverGrootes and Stuiver, 1987). We attribute millennium-scale variations in δ D to temperature changes, whereas the global trend of 8D with depth integrates past changes in thickness and ice flow. (2) Changes in temperature at the moisture source influence δ of Antarctic snowfall. A 1°C increase in SST has the same effect on δ D over central Antarctica as a local temperature decrease of 0.7°C (Reference Koster, Jouzel, Suozzo and RussellKoster and others, 1992). A systematic correction would have to account for past variations in the SST at the moisture source. However, central Antarctic moisture likely originates from sub-tropical latitudes (Reference Petit, White, Young, Jouzel and KorotkevitchPetit and others, 1991; Reference Koster, Jouzel, Suozzo and RussellKoster and others, 1992) where SST shows little change in the past (CLIMAP, 1981). No SST correction in the past is applied to coastal cores. Changes in the isotope composition of the surface ocean offset δ in Antarctic precipitation. This is corrected using the marine δ 18Osca record (Reference Labeyrie, Duplessy and BlancLaberyrie and others, 1987) scaled by a factor of 8 for deuterium (Reference Craig, Gordon and SpoletoCraig and Gordon, 1965). Over the past 10 000 years, this corrects the Antarctic temperature by 0.2°C.
3. 2. Noise in the isotope-temperature relationship
δ T noise and δ noise
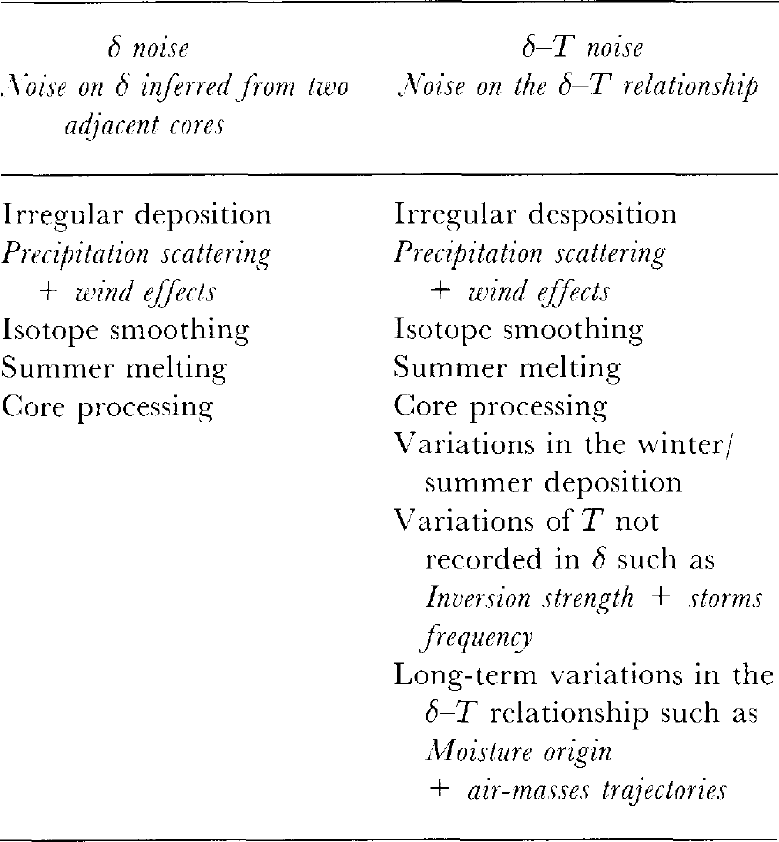
There is a random dispersion on the δ -T transfer function that we call δ -T noise. Its variance, Var (N δ -T(t)), represents a threshold below which a fluctuation in δ is not significant in terms of temperature. Processes entering in δ -T noise are listed in Table 2 (after Reference RobinRobin (1979)). Lacking micro-meteorological data and surface-relief data at the drilling sites, it is very difficult to estimate directly Var(N δ -T(t)) from the variance of each process. One possibility is to examine two parallel cores at the same site. The isotope profiles measured on two such cores are not perfectly correlated, which defines a δ noise, N δ (t). Generally, Var(N δ -T(t)) is larger than Var(N δ (t)), because it contains more processes (see Table 2). We have assumed that these extra processes entering in Var(N δ -T(t)) are much less important than the spatial irregularity in the deposition, given the very low accumulation observed in central Antarctica (Reference BromwichBromwich, 1988). Therefore, we make the approximation:
Table 2 Process entering in the δ noise and δ -T noise
Isotopic noise at Vostok
The drilling of the adjacent cores 3G and 4G makes it possible to estimate directly Var(N(t)). To do so, we decomposed δ of each core as the sum of a climatic signal δ i°(t), common to both cores, plus random noise (Reference Fisher, Rech and ClausenFisher and others, 1985):
Both cores, within a distance of 100 m, have the same deposition conditions, which yields:
and from Equation (3)

From the definition of the 3G-4G correlation coefficient (R3G-4G), we then obtain
Estimating Var(N(t)) from Equation (5) over the interval 0-15000 years BP, we obtained a correlation that was not statistically significant, yielding a noise variance of 15‰ in δ D, a value larger than the expected "climatic" variance during the Holocene (the deglaciation represents about 40‰). This shows that the short-term variability of temperature cannot be extracted from the noise on δ. Therefore, we must choose an arbitrary time-scale for the T fluctuations we want to study. Table 3 shows that the signal/noise ratio is larger than 1 only when periods shorter than 200 years are cut off (one core sample is ≈50 years). To study Holocene temperature changes, we adopted a cut-off period of 500 years (signal/noise = 4). This focuses our discussion on events typically of the same duration as the Little Ice Age. To translate this in terms of an error bar on the reconstructed temperature, we considered the δ- T relation (corrected from ocean composition):
Δδ sea is the difference between the past ocean δ 18O and present-day SMOW. From the experimental error, Var (Δδ sea ) = 0.1%0 (0.8%0 in δ D). Equation (5) gives a noise variance of 2.2%0.
Table 3 Noise on time series of δ D at Vostok
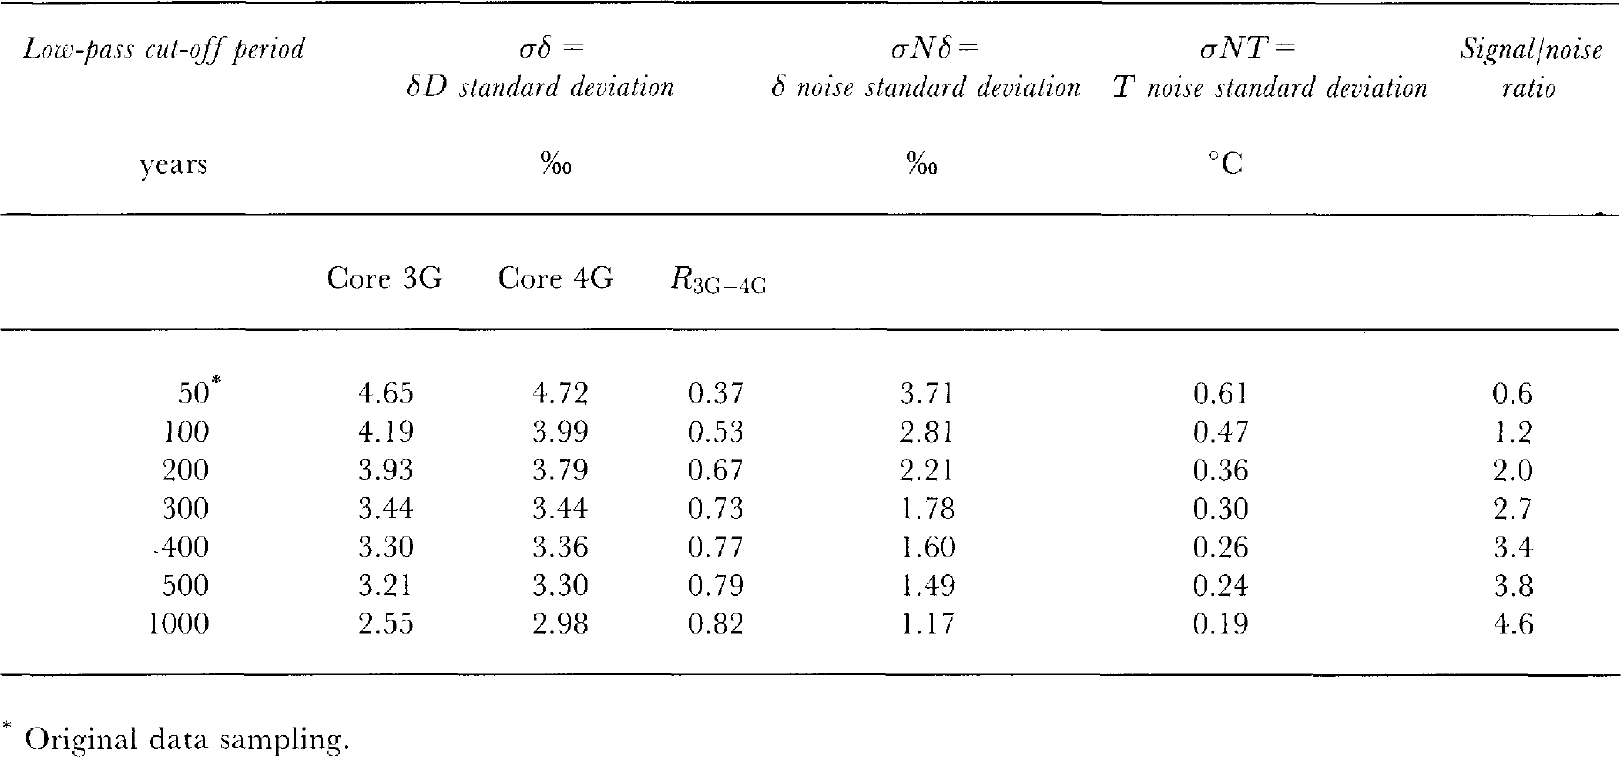

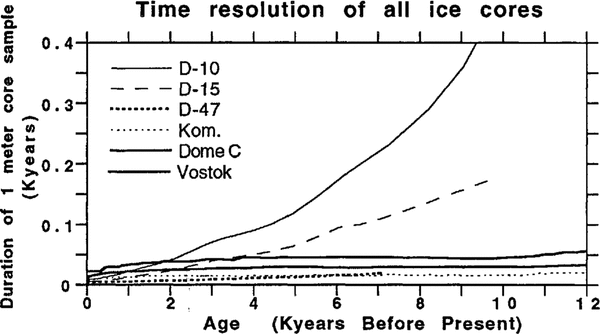
Fig. 5 Average number of years contained in 1m long sample for six Antarctic ice cores (i.e. derivative ∂age/ ∂z). The smaller the number of years, the better the time resolution of the core. Note that coast ice cores have a better time resolution during the late Holocene period and deep ice cores during the early Holocene.

This turns into a standard deviation of 0.25°C which represents physically the threshold below which a variation in temperature derived from the isotope record is not significant when dealing with isotope data filtered at .100 years. This value is intuitively an upper estimate of the isotopic noise in Antarctica because Vostok has the lowest accumulation. At Dome C, based on the dispersion of δ D on 20 surface cores, Reference CiaisCiais (1991) estimated an isotopic noise of 0.3°C (data filtered at 500 years). In coastal regions, one would expect the snow deposition to show less scatter than inland, because of larger accumulations. However, this may be counterbalanced by substantial wind scouring of freshly deposited snow (Reference Wendler and OerlemansWendler, 1989; Reference Parish and WendlerParish and Wendler, 1991). From the δ D variability of surface cores, we provided a rough estimate of the noise variance at D-47 of 0.2-0.3°C (Reference CiaisCiais, 1991).
4. Holocene antarctic climate
4.1. Paleo-temperature reconstruction
Distortion due to ice-core sampling
The core-sampling increment for isotopes is constant with depth. Therefore, because of the vertical ice thinning, one sample represents more years at greater depths. The number of years contained in a given sample, which characterizes the time resolution of the core, is calculated from the age Z function, A (Z), and the sampling increment, , using Equation (9):
Δ as a function of Z is shown for all cores in Figure 5. Deep ice cores have an almost constant Δt, because Holocene ice is high above the bedrock and does not undergo strong vertical thinning. In contrast, coastal ice cores are characterized by a strong increase in Δ with depth. In the case of D-10, for instance, a 1m long sample contains ≈2years near the surface and ≈500 years at Z = 200 m. To present our records in a manner that is not distorted by ice-flow-induced thinning, the data were digitized to create an annually sampled time series, which was filtered to remove periods of less than the maximum value of Δ along the core. A cut-off period of 500 years was found to satisfy both requirements of the noise and of the sampling (Fig. 6).
4.2. Antarctic temperature trends
Average temperature curve
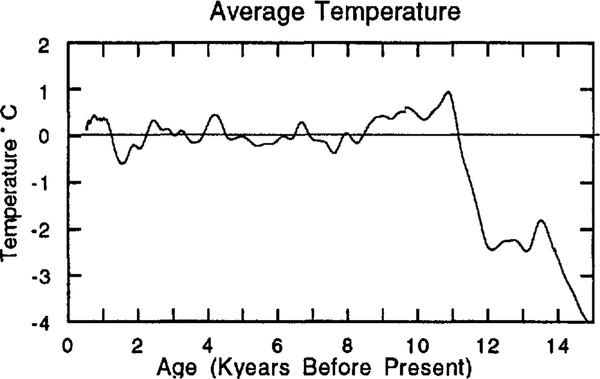
We observed that intervals characterized by colder temperatures can be correlated in most of the curves and we derived an "average temperature" curve. Temperature fluctuations do not exceed 1.2°C in any core (large variations at D-10 are likely to be due to the non-continuous sampling of the core and D-10 is excluded from the average). From Figure 5, it is seen that the climate of the early Holocene is better resolved in the deep ice cores, whereas the late Holocene is better resolved in coastal ice cores. We have attributed to each time series a weight ω proportional to its time resolution Δ as defined by Equation (8)

The weighted average temperature, T̄(t), is then expressed by:

T̄(t) is shown in Figure 7. Considering a weighted average in place of a simple average does not change the timing of the T fluctuations, although it has the effect of changing their amplitude in such a manner that T̄(t) is dominated by Vostok and Dome C in the early Holocene, and by D-47 and D-15 in the late Holocene. Maximum temperatures (1°C warmer than today) prevail between 11 000 and 8000 years BP, defining an early Holocene optimum (Reference CiaisCiais and others, 1992). The most significant cooling is from 8000 to 5500 years BP. The late Holocene is characterized by a stable average temperature. A noticeably warmer climate episode occurred around 4000 years BP. An important cooling occurred between 2000 and 1000 years BP.

Fig. 6 Temperature reconstructed from the isotope profile of six Antarctic ice cores. isotope data have been filtered in order to remove all periods shorter than 500 years to minimize the noise on the data. Temperature variations are expressed as the departure from the mean value over the past 5000 years. A constant offset has been added to each profile for display clarity. The D-10 reconstructed temperature shows fluctuations of magnitude 3-4°C as a consequence of discontinuous sampling of the core and is not included
Comparison with the Byrd ice-core record, West Antarctica
The Byrd δ 18O (sec for instance, Reference Johnsen, Dansgaard, Clausen and LangwayJohnsen and others, 1972) shows a rapid increase of 1.5%0 at 4500 years BP, which is absent from the East Antarctic cores. Assuming a δ 18O-T gradient of 0.8%0 °C-1, this increase translates into a regional warming of 2°C. A change in the ice thickness (thinning of 200 m) or in the moisture supply to West Antarctica is more likely to have occurred.
Early Holocene Antarctic climate and" Holocene optimum"
Evidence for maximum temperatures during the first 2000 years of the Holocene contradicts the commonly admitted picture of a worldwide mid-Holocene optimum (Reference LambLamb, 1977; Reference Folland, Karl, Vinnikov and HoughtonFolland and others, 1990). If higher δ D in Antarctica did not reflect warmer temperatures, then one would have to look for changes in (1) elevation and ice flow, (2) moisture source and (3) source composition. Our curves are already corrected from (3). Regarding point (2), isotopic models demonstrate that SST influences δ D according to (Reference Koster, Jouzel, Suozzo and RussellKoster and others, 1992)
Te = sea-surface temperature, Tp = site temperature.
The SST in the Southern Ocean were warmer than today during the early Holocene, as inferred from the marine record (Reference Hays, Imbrie and ShackletonHays and others, 1976; Reference LabracherieLabracherie and others, 1989). This would yield even warmer Antarctic temperatures in the early Holocene. Point (1) can be discussed qualitatively, provided that the central EAIS did not change by more than ±200 m during the climatic transition (Reference HuybrechtHuybrecht, 1990; Reference MartinerieMartinerie, 1990). Greater δ D values during the early Holocene could be attributed to a change in elevation if the EAIS remains thinner than today up to 8000 years BP, and then thickens rapidly to reach its present characteristics. This would translate into a change in accumulation of 10cm year-1 at around 8000 years BP, which is not compatible with the isotope data (Equation (1)). A step further would be to compare our Antarctic temperature record with the climate of high southern latitudes over the past 15000 years. There are terrestrial and marine 14C dated paleoclimate records in South America, New Zealand, Tasmania and in the Southern Ocean.
Conclusions
In the six ice cores examined in this work, the Holocene period is characterized by fairly constant δD values. Because the climate signal contained in the isotopes is embedded in a strong noise (irregular snow deposition), the data were filtered to minimize the signal/noise ratio. The average temperature curve shows warmer conditions than at present during the Holocene interval (11 000 and 9000 years BP) by about 1-2°C. The late Holocene period is characterized by shorter fluctuations, the most notice-able being a warm peak around 4500 years BP and a cold interval around 2000 years BP.
We have restricted the present study to the isotopes, a proxy primarily related to local changes. Variables of more global character (gases and chemical impurities) are also reconstructed from ice cores. They relate to past atmospheric composition and circulation, as well as to the emission by sources. Within the Holocene interval, the concentration of dust is fairly constant but CO2 and CH4 appear to be higher during the early Holocene, concomitant with the local maximum in temperature. A better knowledge of the Holocene from the ice-core record can be placed in perspective with an abundance of paleoclimate reconstructions worldwide. Hopefully, this will help to explain why climate conditions have been so remarkably equable over the past 10 000 years in contrast to the large and rapid changes observed during Glacial and late-Glacial periods.


