


Introduction
Since the first simulations of the Last Glacial Maximum (LGM), using atmospheric general circulation models (AGCMs) (Reference Williams, Barry and WashingtonWilliams and others, 1974; see also Streel-Perrol (1991) for a review), progress has been made both on the parameterization of physical processes and on the selling of boundary conditions. This lasi point is crucial because we perform "snapshot" experiments and compute the atmospheric response in equilibrium with different boundan conditions. Some of these conditions are very accurately defined, such as the insolation in the upper atmosphere (Reference BergerBerger, 1988), or atmospheric composition (mainly CO2 partial pressure) Reference Raynaud, Jouzcl, Barnola, Chappellaz, Delmas and LoriusRaynaud and others, 1993). Others, such as sea surface temperature (SST) or ice sheets, are more difficult to reconstruct. In the 1980s and at the beginning of the 1990s, most simulations of the LGM used the CLIMAP (1981) SSTs (Reference Broccoli and ManabeBroccoli and Manabe, 1987; Reference RindRind, 1987; Jous-saume, 1993), whereas in the more recent ones AGCMs are coupled with a mixed-layer ocean and so the CLIMAP dataset is not used to prescribe SSTs (Reference Webb, Rind, Lehman, Healy and SigmanWebb and others, 1997).
Of course, the problem is different for ice-sheet reconstruction. Many AGCM experiments have studied the sensitivity of the LGM climate to the ice-sheel reconstruction (Reference Shinn and BarronShinn and Barron. 1989; Reference Ramstein and JoussaumeRamstein and Joussaume, 1995). Since 1994, the Pellier reconstruction has been available (Reference PeltierPeltier. 1994). In the framework of the Paleoclimate Modeling Intcrcomparison Project (PMIP) (Reference Joussaume and TaylorJoussaume and Taylor, 1995), this reconstruction has been chosen as a common boundary condition for all the models performing the LGM simulation.
The aim of this paper is to investigate the ice-sheet mass balance through different versions of the Laboratoire de Meteorologie Dynamique (LMD) AGCM. To achieve this, we used two different approaches: the "direct" approach uses model outputs over the Laureniide and Fcnnoseandian ice sheets to analyze ice-sheet mass balance; the "coupled" approach uses model outputs (mainly temperature and precipitation) to force an ice-sheet model (Reference Ritz, Fabre and LetreguillyRitz and others, 1996), the physics and resolution of which are more refined, to investigate through a time-step simulation, whether ice sheets are maintained or melt (Reference Fabre, Ritz and RamsteinFabre and others, 1997).
Methodology
Direct approach
Using the Reference PeltierPeltier (1994) reconstruction, we performed the LGM simulations with three different versions of the LMD AGCM: LMD4, LMD 4.3 and LMD5.3. Moreover for the LMD4 version, we constrained the LCLM simulation with two different ice-sheet reconstructions: CLIMAP 1981 and Reference PeltierPeltier (1994). The imparl of the ice-sheet reconstruction on its mass balance is weaker than the changes in model parameterization (see below). Thus we decided to use only the more recent Reference PeltierPeltier (1994) reconstruction for the experiments with LMD4.3 and LMD5.3. Moreover, all these runs were performed using prescribed SSTs deduced from CLIMAP (1981). In Table 1, we list a synthesis of the Four differenl LGM runs.
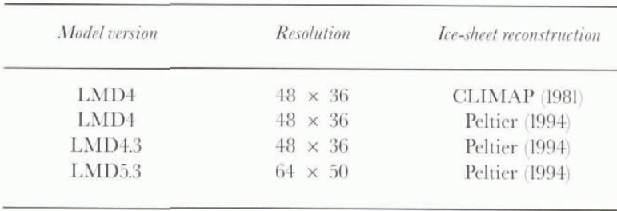
Table 1. Synthesis of the LMD AGCM simulations of the Last Glaciol MAximum
Common features and differences between the three LMD versions
All the numerical experiments described below have been performed using the LMD AGCM. This is a gridpoint model using an Arakawa C-grid (Reference Sadourny, Laval, Berger and NicolisSadourny and Laval, 1984). The radiation scheme is the same as that used in the European Center for Medium-Range Weather Forecasts (ECMWF) model: the solar part is a refined version of the scheme developed by Reference Fouquart and BonnelFouquart and Rounel (1980) and the terrestrial component is from Reference MorcreteeMoreretle (1991). The boundary layer is parameterized using a diffusive equation in which the mixing coefficients depend on a prescribed length scale and a diagnostic determination of the turbulent kinetic energy. Condensation is parameterized separately for convective and non-convective clouds. Convection is parameterized using, in sequence, a moist adiabatic adjustment and a modified version of the Reference KuoKuo (1965) algorithm. A prognostic equation for cloud water is included in the model: sources and sinks of cloud-condensed water are parameterized and the large-scale transport is taken into account.
LMD4 and LMD4.3 improvements
The main sink of cloud water is the precipitation process, which uses different parameterizations in the LMD4 and LMD4.3 versions (Reference Le Treut, Li and ForichonLeTreut and others, 1994).
-
(i) The first approach, used in the basic LMD4 version of the GCM, simply consists of prescribing a threshold for the precipitation of cloud water: the water in excess of the threshold is precipitated to the ground. It is necessary to distinguish between warm and cold clouds, and a lower threshold is used for clouds the top layer of which is below -15 °C. This is a very simple way to account for the Bergeron process, by which ice clouds precipitate more efficiently. A validation of this first scheme in terms of cloud cover, using the International Satellite Cloud Climatology Project (ISCCP) data over the Meteosat area, gave good results (Le Trent and Li, 1988).
-
(ii) Deficiencies of the simple parameterization described above became obvious when comparisons with Scanning Multichannel Microwave Radiometer (SMMR) estimates showed that the integrated cloud water content was too low. In addition, comparisons with Earth Radiation Budget Experiment (ERBE) data showed that the longwave cloud forcing was too large at high latitudes. The discontinuities introduced by the threshold approach also presented a serious problem for further comparisons with observations (Reference Yu, Doutriaux, Seze, LeTreut and DesboisYu and others, 1996), as well as climate sensitivity studies (Reference Li and Le TreutLi and LeTreut, 1992),The LMD4.3 version of the model was therefore developed. Cloud precipitation in the liquid phase is described using a formula first proposed by Simdqvisi (1981). It allows a transition from a thin, non-precipitating to a thick, strongly precipitating cloud regime that is smoother than with the threshold method. Precipitation from ice clouds is treated through a simple ice-sedimentation mechanism, in which the precipitation rate depends on the terminal velocity of the falling crystals. Finally, a linear transition between ice and water clouds is also defined between 0°C and -15°C. The fraction of a given cloud in the liquid phase decreases linearly from 1 to 0 between these two temperatures.
The water condensed in convective clouds is retained as cloud water, and precipitates according to the same parameterizations as those used in the stratiform case. This feature, which is not shared by many models, partly explains the strong association of convective or stratiform clouds with the intertropical convergence zone. This is a notable feature of the LMD GCM.
LMD4.3 and LMD 5.3 improvements
The main new Features of the LMD5.3 version are the treatments of the surface and the surface-atmosphere interaction. This version includes a sub-grid representation of fractional sea-ice cover. A distribution between eight biomes represents, for each cell, the type of vegetation. The surface scheme representing the hydrologic exchanges between atmosphere and biosphere is SECHIBA (Schcmatisation des Eehanges Hydriqucs a l'Interfaces Biosphere Atmosphere; Reference Ducoudre and LavalDucoudrc and Laval, 1993). Albedo is computed from the values of snow depth, cover and age, and vegetation cover (Reference Chalita and LeTreutChalita and Le Trent, 1994).
Resolution
We use two different resolutions. For LMD4 and LMD4.3, we use the low resolution: 48 points regularly spaced in longitude. 36 points regularly spaced in sine of the latitude and 11 vertical levels. For the LMD5.3 version, we use the standard resolution, which has a better horizontal resolution: 64 points in longitude and 50 points in latitude. Each horizontal gridcell has a constant area. The vertical coordinate is the normalized pressure.
Ice-sheet reconstruction
A major difference between present and LGM climate is the large ice sheets covering northwestern Europe Fenno-scandia) and the northern part of North America (Lauren-tide). The shape and size of these ice sheets have a major impact on the atmospheric dynamics over the Northern Hemisphere during the LGM, especially concerning the split of the jet that may have occurred as a result of Lauren-tide ice sheet influence on planetary waves (Reference Kutzbach and GuetterKutzbach and Guetter, 1986; Reference RindRind, 1987). Reference Denton and HughesDenton and Hughes (1981) provided two reconstructions referenced as MIN and MAX, corresponding to eustatic sea-level rise values of 127 m and 163 m. Reference PeltierPeltier (1994) showed that even the MIN reconstruction was excessive and proposed a new reconstruction based on a gravitationally self-consistent theory of relative sea-level changes. It corresponds to an eustatic sea-level rise of 105 m, In Figure 1, we show the change in elevation between the LGM and the present climate for the reconstructions devised by Reference PeltierPeltier (1994) (for both resolutions) and CLIMAP (only the low resolution is used. The extent of the ice sheets is not very different, but the elevation is 1500 m higher over the Laurentide, and about 1000 m higher over Fennoscandia in the CLIMAP reconstruction. Moreover, the smaller sea-level rise in Peltier's reconstruction leads to a reduction of emerged lands. We lake this into account and use different sea-land masks for the two simulations.
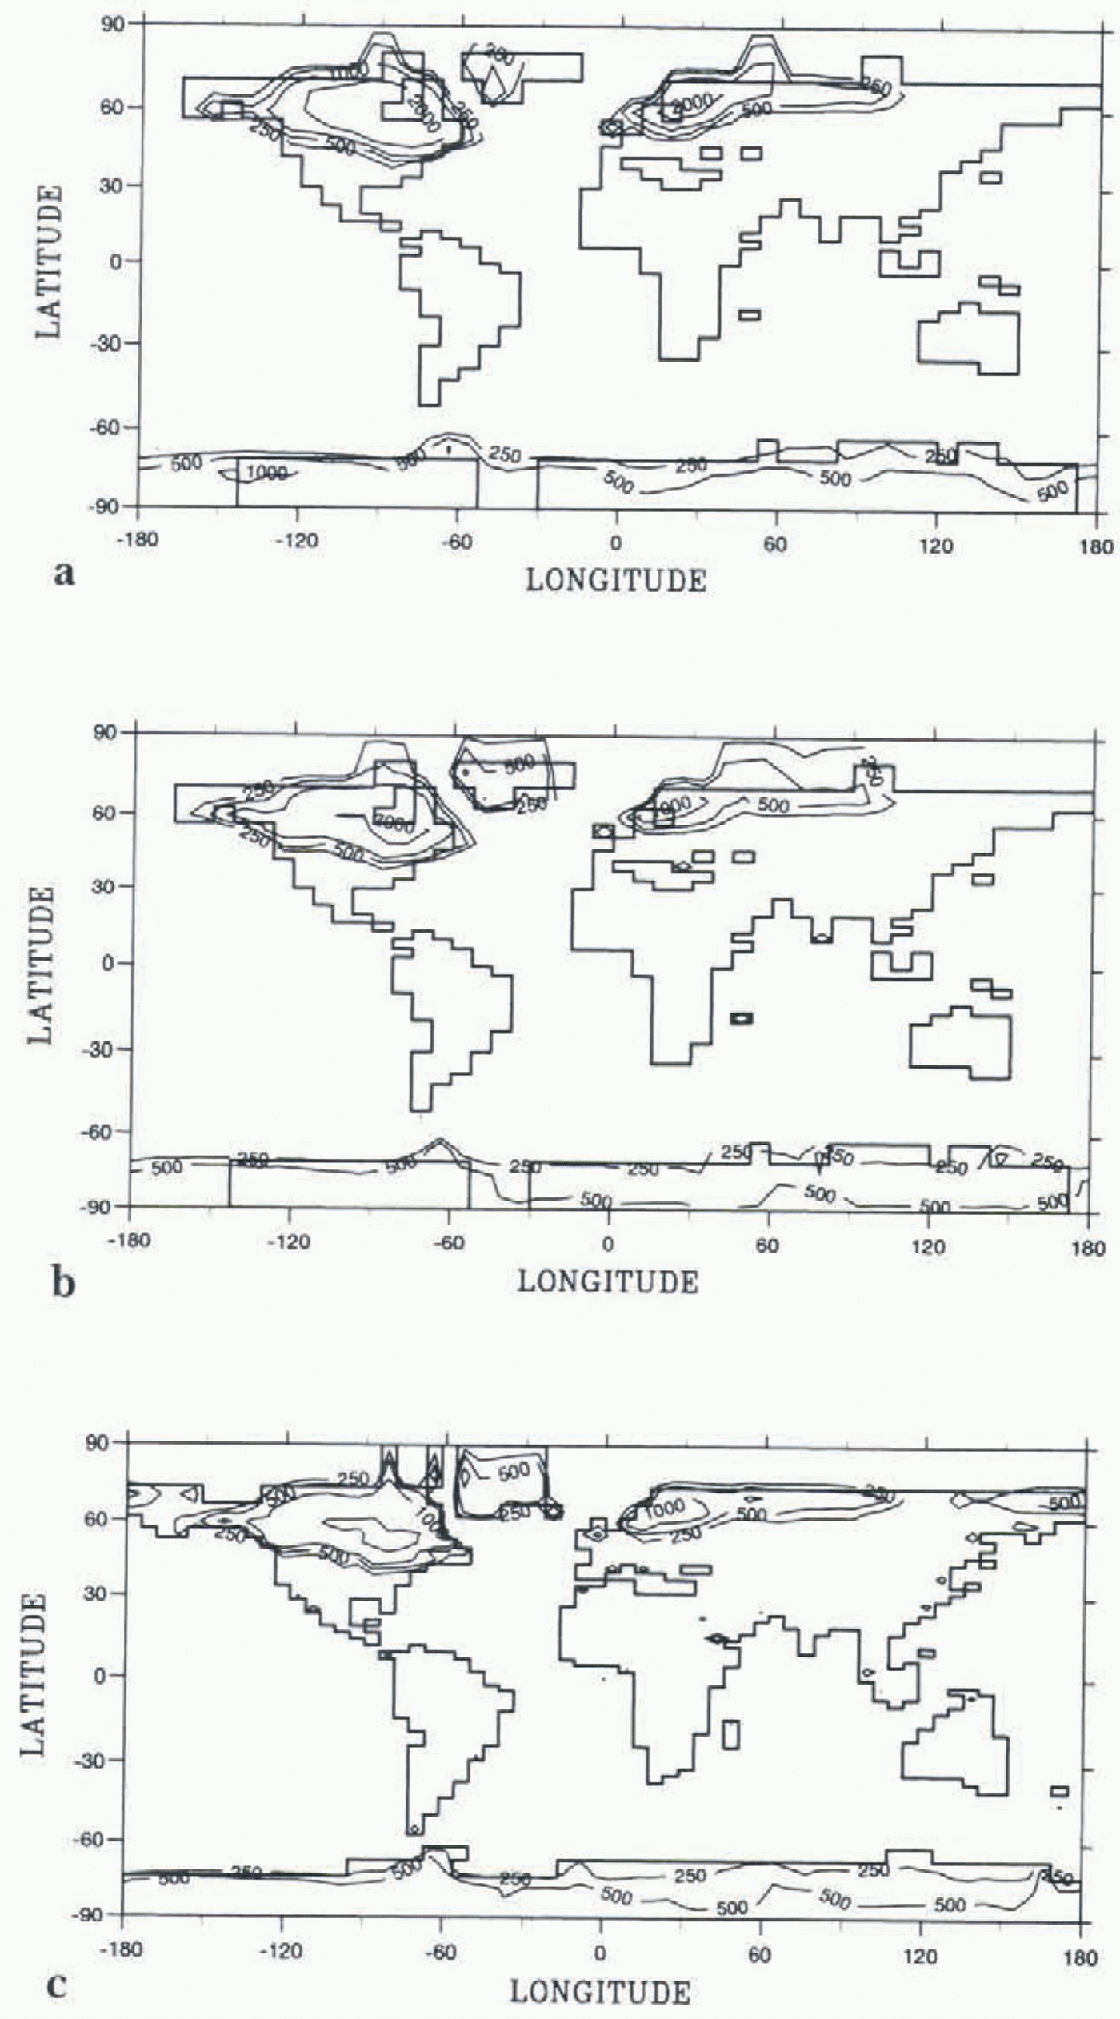
Fig. 1. Ice-sheet reconstructions and AGCM grid for (a) CLLMAP(1981) ice sheets interpolated on the 48 x 36 grid used for LMD4, (b) Reference PeltierPeltier (1994) ice sheets interpolated on the 48 x 36 grid used for LMD4 and LMD4.3. (c) Reference PeltierPeltier (1994) ice sheets interpolated on the 64 x 50 grid used for LMD5.3
Coupled approach: AGCM outputs driving an ice-sheet model
The ice-sheet model is a three-dimensional (3-D) thermo-mechanically coupled model. It takes into account the coupling between temperature and velocity fields, and belongs to the same category of ice-sheet models as those developed by Reference Huybrechts and T'siobbelHuybrechts and T'siobbel (1995) and Reference Greve and HutterGreve and Hutter (1995). The evolution of ice-sheet geometry is a function of mass balance, velocity, Iemperaturc fields and bedrock position. The ice-sheet model (see Reference Ritz, Fabre and LetreguillyRitz and others, 1996) for a comprehensive description) was used successfully on the Greenland ice sheet (Reference Fabre, Letreguilly, Ritz and MangeneyFabre and others, 1995) and has since been extended to the whole of the Northern Hemisphere for present and LGM climates (Reference Fabre, Ritz and RamsteinFabrc and others, 1997). We now describe briefly the mass-balance calculation.
The mass balance is the sum of four separately computed terms: accumulation, ablation, caking and melting at the bottom of the ice sheet. Accumulation is a key factor computed from interpolated AGCM temperatures and precipitation. Ablation is computed using the "positive degree day method" (Reference ReehReeh, 1991), there is no treatment of ice shelves in the model. Calving is computed by setting the ice thickness to zero on a "coastal line" determined by the sea level. A sea-level drop is taken into account for the LGM corresponding to 105 m for the Feltier (1994) reconstruction, and of 163 m for the CLIMAP (1981) maximum reconstruction. The iso-static variation of the bedrock, resulting from an evolving ice load, is governed by two components: an asthenospheric flow with a characteristic response time of 3000 years and a lithospheric rigidity that is taken into account by the spatial shape of the deflection.
Analysis Of the Results
Direct approach
The climate of the LGM is globally colder than present In all of these simulations, the annual mean difference of temperature between the LGM and a present control run is -3.3°C (Reference Ramstein and JoussaumeRamstein and Joussaume, 1995; Reference Ramstein, LeTreut, Serafini, Forichon and JoussaaumeRamstein and others, in press). Temperature change is a strong function of latitude, with a cooling of more than 10°C at high latitudes, and only 1°C for the tropics. Moreover, the temperature decrease is large over the ice sheets, especially in the summer when orography and albedo impacts are superimposed reaching values between -15 and -25°C, depending on the versions used. Another region of drastic cooling is the northern Allanlic Ocean. This is clue to sea-ice extent and change in atmospheric circulation (mainly splitting of the jet that brings cold polar air masses towards the Ntirlh Atlantic Kutzbaeh and Ciuetter, 1986; Reference RindRind. 1987. In this area, the annual mean temperature cooling is about 25°C.
The hydrologic cycle is also strongly modified. A colder climate leads to a global decrease in the hydrologic cycle, whereas the water transport from Equator-to-Pole is increased due to the enhancement of the Hadleyeells (Ram-sicin and others, in press). The decrease is weaker and more uniform in winter (—8% of water vapor in the atmosphere . and more pronounced and localized over the Northcrn Hemisphere mid and high latitudes -16%) during summer (Reference Ramstein, LeTreut, Serafini, Forichon and JoussaaumeRamstein and others, in press).
In this paper, we will focus our discussion on the Laur-eiilide and Fennoscandian ice-sheet mass balance through different versions of the LMD AGCM. Tb quantify the impact of the ice-sheet reconstructions on mass balance, we Iusi performed two simulations using LMD4 and two differenl ice-sheet reconstructions (CLIMAP 4981 and Reference PeltierPeltier (1994). In Figure 1. we show the orographic difference between the LGM and the present for the CLIMAP (1981) ice-sheet reconstruction interpolated on the low-resolution horizontal grid, and the Pcliicr 4991 reconstruction interpolated on the low- and standard-resolution horizontal grid. From these maps, we define two spatial areas covering the Lanrentide and Fennoscandian ice sheets. In Table 2. we present for each ice sheet all the simulations of the annual summer and winter av erages of the water balance (differences between precipitation and evaporation, plus runoff), each term of this balance equation, and surface temperature. We also present the mean annual net snow accumulation isnowfall minus snowmelt). For all LGM runs, we observe an annual positive hydrologic balance, but the accumulation has different amplitudes within the different versions.
Table 2. Annual, summer and winter averages over Laurentide and Fennoscandian ice sheets of the surface temperature (0° C). water mass balance in mm d-1. (precipitation, evaporation, runoff) and annually averaged net snow accumulation in cm for all LCM simulations
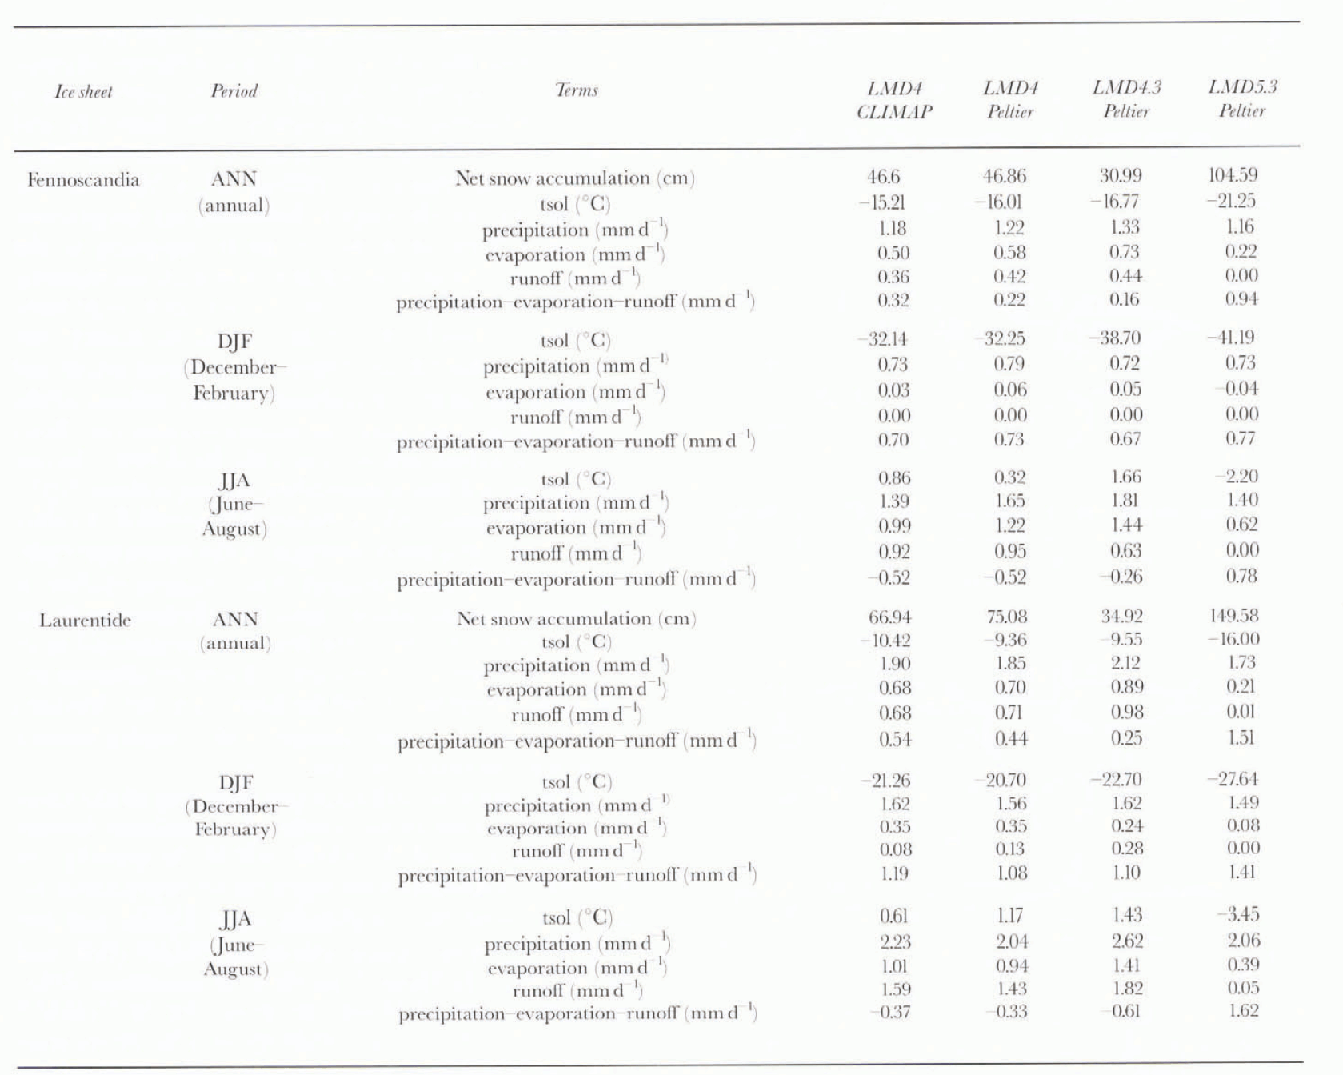
Table 2 shows an important feature: the seasonal behavior is different for LMD5.3 compared to the LMDI models. For the previous versions, there is a strong accumulation during winter, and a weaker "melting" during sunmier because temperatures reach positive values. For LMD5.3, accumulation occurs for both seasons with the same order of magnitude and, over Fennoseandia, more accumulation occurs during March, April and May and during September, October and November (not shown).
Over both ice sheets. LMD5.3 has accumulation rates 3-5 times higher than the other versions (LMD4 and LMD4.3, respectively). This increase results partly from cooler temperatures that allow more snowfall in summer, but it is mainly due to the drastic decrease in evaporation and runoff (Table 2). In contrast to the other versions, LMD5.3 always gives negative summer temperatures over the ice sheets, which lead to a severe decrease of evaporation and inhibit the runoff.
The ice-sheet mass balance produced by LMD 4.3 is the lowest (a factor of 2 lower than LMD4). The main reason for this decrease is that this version has the highest summer temperatures, and therefore the highest evaporalion and runoff rates during summer. This compensates for the slight precipitation increase, and leads to a nearly balanced water budget. Tlie colder surface temperatures of LMD5.3, especially in summer, are the consequence of the higher snow albedo specified over the ice sheet i Reference PinotPinot. 1995. If we now compare the simulations performed with LMD4 using the two different ice-sheet reconstructions, the accumulation rates for both ice sheets are higher than for LMD4.3. This is mainly due to lower, positive, summer surface temperatures. There are very small differences in the water balance between the two LMD1 simulations using different ice sheets. These results indicate that the impact of the different paramctcrizalions used in the models on iec-shect mass balance is greater than the changes in the ice-sheet recon-structions.
Tb simplify the description of the results, the LMD5.3 simulation, which is the most recent version and has the highest resolution run, is presented in more detail. Figure 2 gives the annual mean total precipitation and snowfall for this simulation. If most of the precipitation over the ice shcci is snowfall, then the hydrologie balance discussed above is indeed consistent with the net snow accumulation. Precipitation is very Itw over the central Laurentide, but higher on the eastern and western sides (where values as high as to mm d -1 are reached). Over the northeastern Paci-fic there are high precipitation rates due to the warm LGM SST given by the CLIMAP (1981) reconstruction. This region is an important source of the water vapour that produces the high precipitation rates over the extreme western part of the Laurentide ice sheet. On the eastern side, there tire also high precipitation rates corresponding to winter storms occurring at the location of the sca-ice extent, and the Ice landic winter low. Over the Pennoscandian ice sheet, precipitation and snowfall are also similar, having low values at about 1 mm d-1.
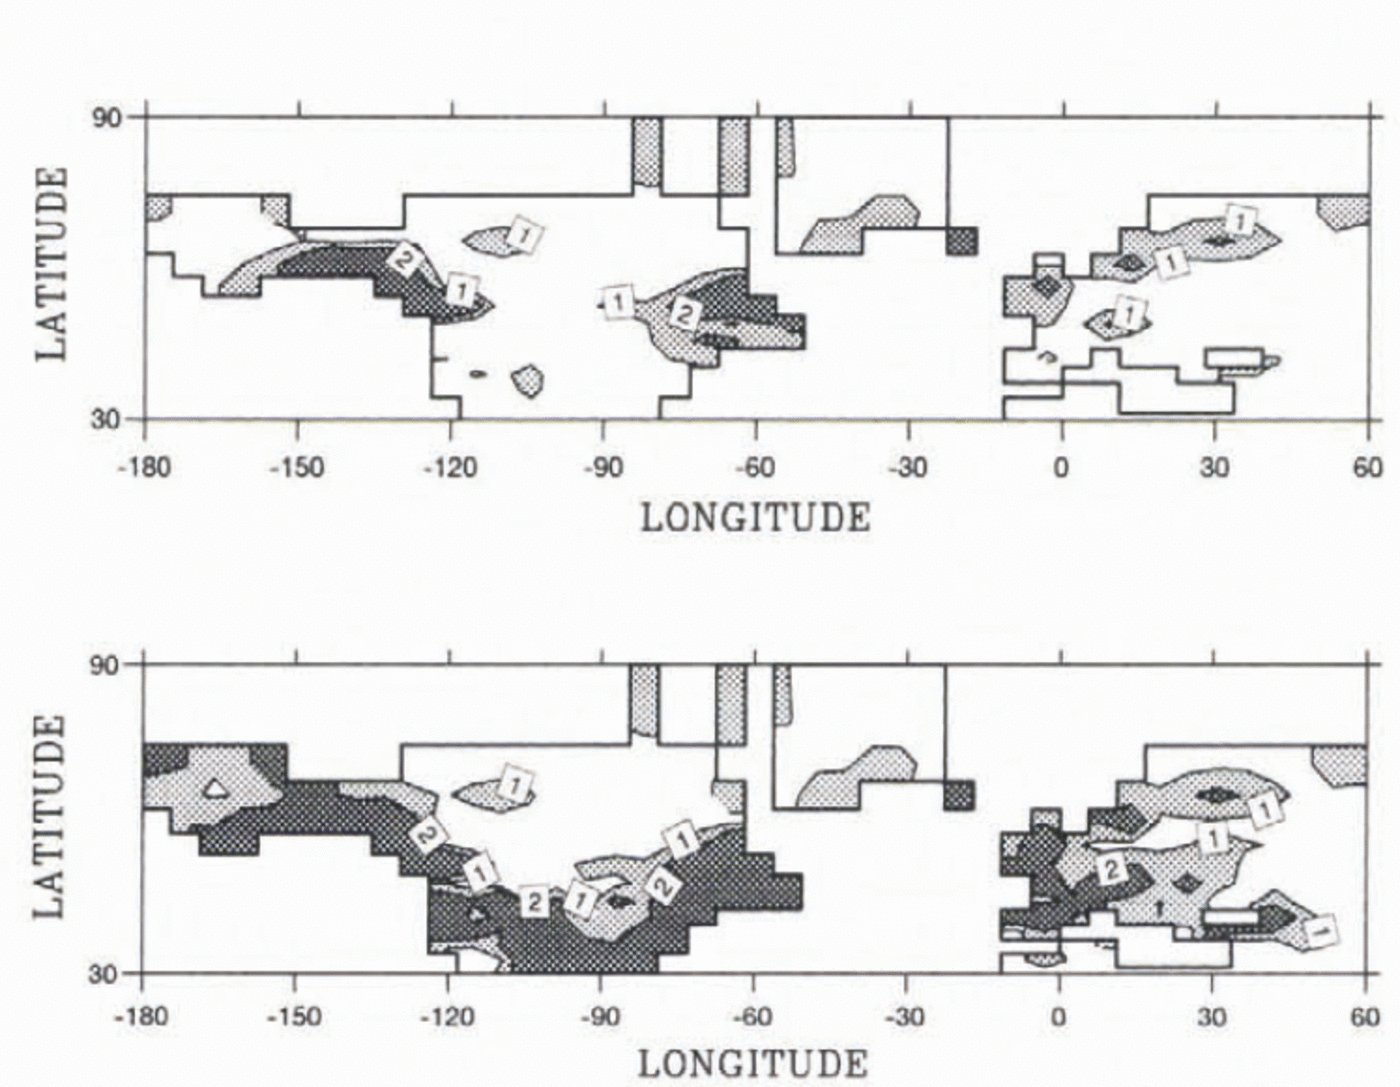
Fig. 2. Annual mean for LMD5.3 LCM simulation. Top: snowfall (mmd-1) and bottom: precipitation (mmd-1).
To understand better the snow mass balance over the ice sheets in LMD5.3, we have plotted the annual mean snowfall, snowmelt, and snow accumulation during the 16 simulated years of the run on the same diagram (Fig. 3). Once more, we observe that there is an important snow ac-cumulation over the extreme western and eastern parts of the Laurenlide ice sheet, but there is little or no accumulation over the central region. Over Fennoscandia, there is a more homogeneous accumulation. The data presented in Figure 3 suggest, lherefore, that snow accumulation reflects the spatial pattern of snowfall. Melting also occurs over the same areas, but is weaker due to very cold temperatures and is five times lower than the snowfall rate. To compare this result to the nel snow accumulation of the other model versions, Figure I shows the net snow accumulation for all the LGM runs. Snow accumulation is computed over the length of the run, which is 16 years for LMD5.3 and LMD 1.3, but only 6 years for LMD4.
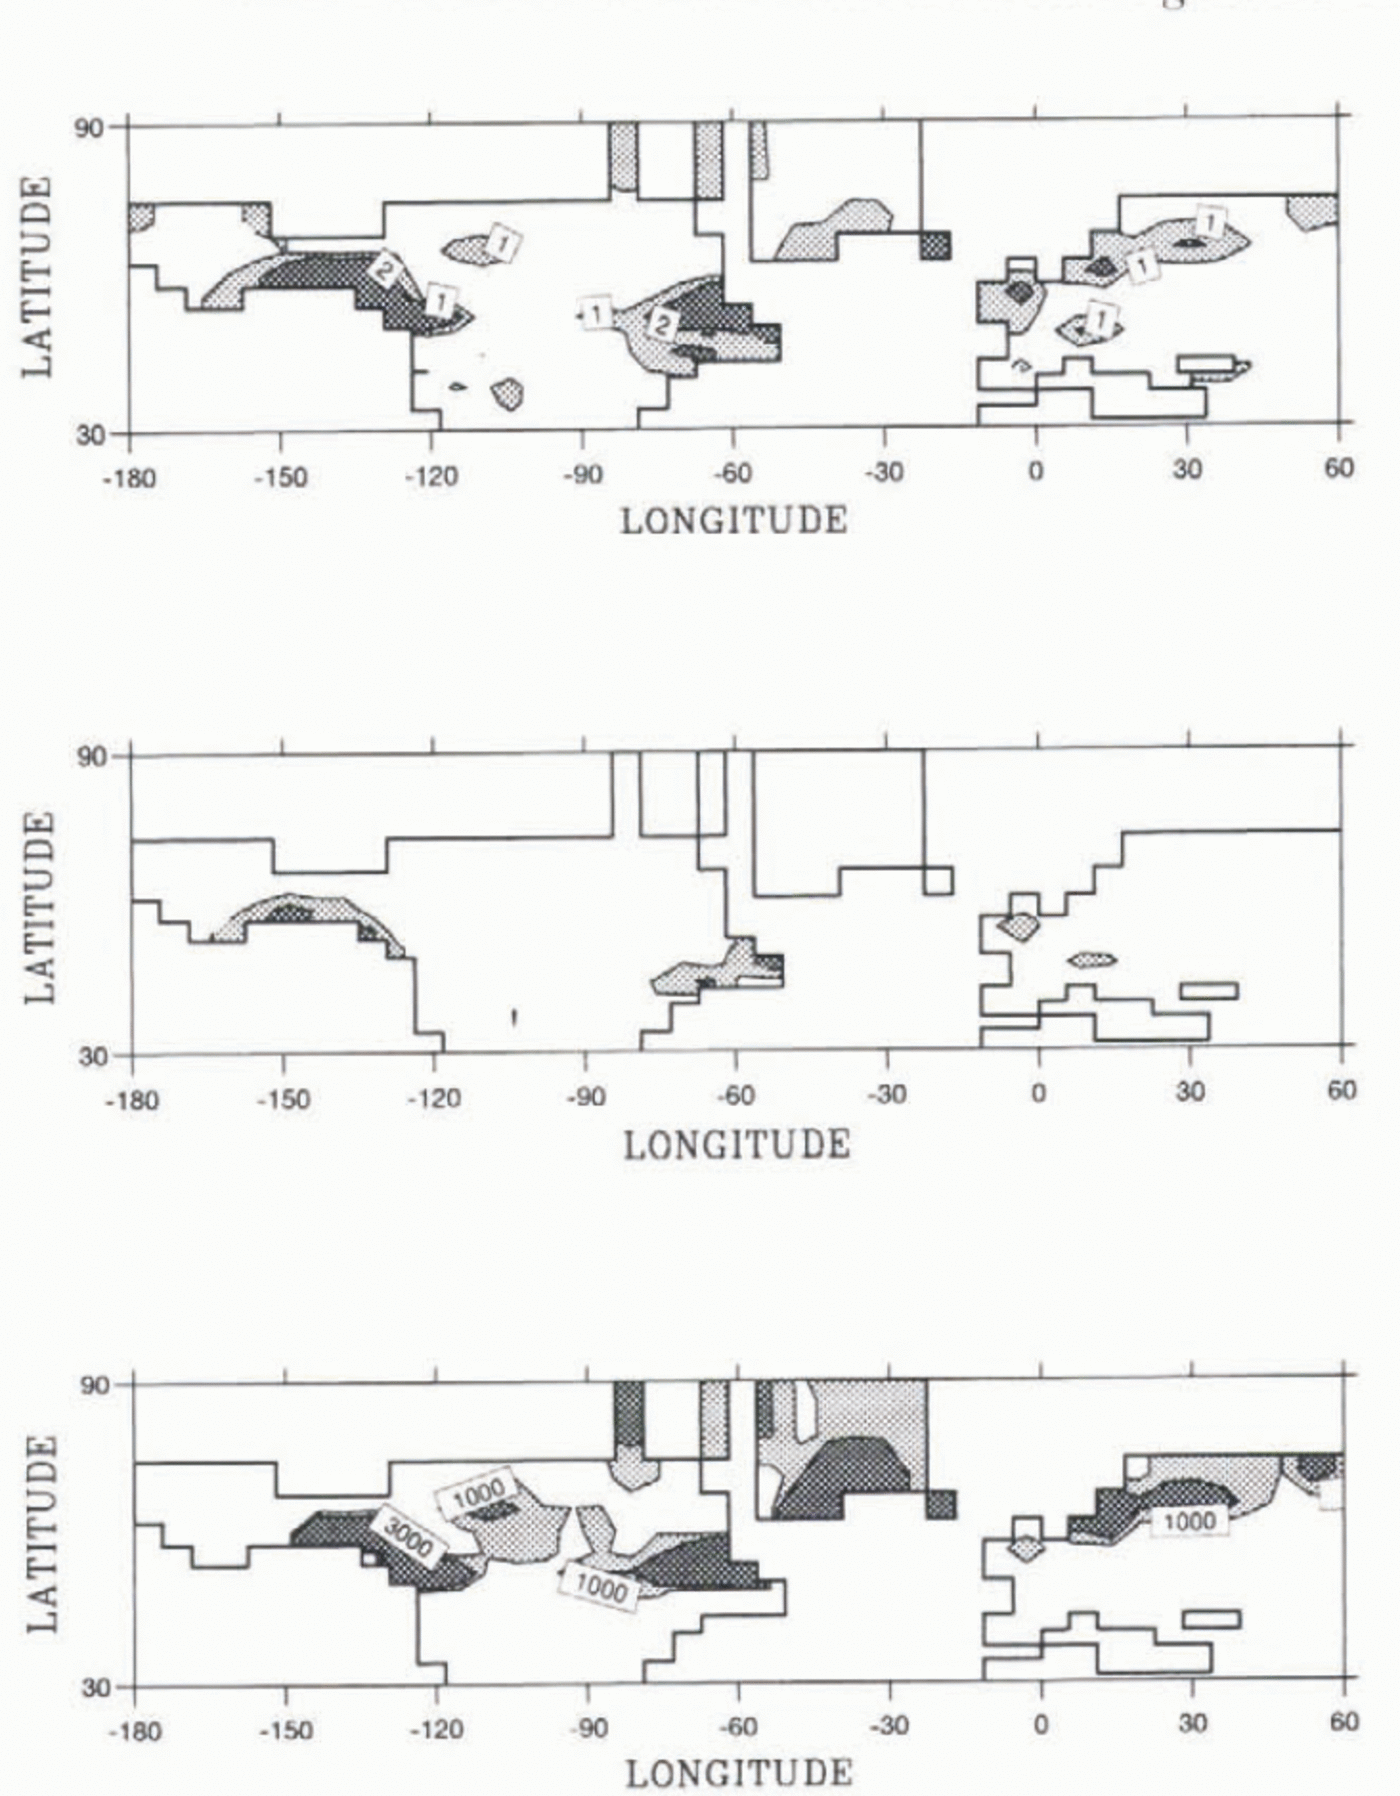
Fig. 3. Annual mean for LMD5.3 LCM simulation. Top: snowfall (mmd -1 middle: smow melt (mmd-1) and net snow accumulation for the 16 years of the run (mm d-1).
To compare more easily the different plots shown in Figure 4. we divided In three the scale used for these two last runs. (For annual net accumulation, see also the values in Table 2.) Again, we observe that the largest net accumulation occurs in LMD5.3. The geographical pattern of the net snow accumulation is similar for all the model versions, with an area of accumulation localized on the western and eastern margins of the Laurenlide ice sheet, and a more homogeneous distribution over the Fennoseandian ice sheet this spatial similarity, despite differences in the amplitude, shows that prescribed SSIs that are a common feature of all these runs (see the methodology section) play a major role in the snowfall pattern. The warm Pacific provides high snow fall on the western margin of the Lauren-tide, while winter storms, localized over the northwestern Atlantic, contribute to snowfall on the eastern margin. The prescribed SST appears to be more important than the differences between model versions or ice-sheet reconstructions.
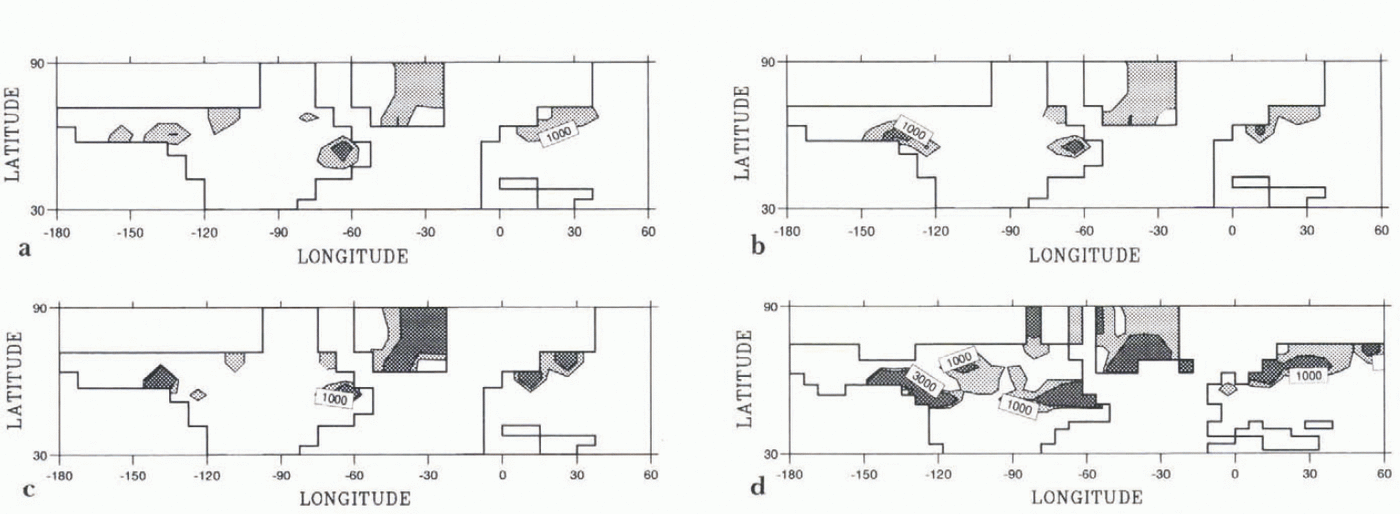
Fig. 4. Snow accumulation for LGM simulations, (a) LMD4 CLIMAP (1981) 5 year run. (b) LMD4 Reference PeltierPeltier (1994) 5 year run. (c) LMD4.315 year run, (d) LMD5.315 year run.
Ice-sheet model driven by AGCM outputs
In the ice-sheet model. Reference PeltierPeltier (1994) or CLIMAP (1981) reconstructions may be used as an initial condition for the LGM runs. To account for the isostatic rebound, a crude approximation is used in whic h the bedrock lowering is a third of the ice thickness. The isostatic- rebound is then computed by the model. In the ice-sheet model, snow accumulation and ablation are derived from AGCM outputs. Snow accumulation is computed from annual mean surface temperature and precipitation, and ablation is computed from summer (June, July and August) and annual surface temperatures. Note that these AGGM fields are not directly used in the ice-sheet model (see Reference Fabre, Ritz and RamsteinFabre and others (1997) for a detailed discussion of the coupling method).
In the following section, we describe the treatment of the AGCIM output before it is used in the ice-sheet model. A major problem is the difference in resolution of both models. The initial database provided by Reference PeltierPeltier (1994) has a 1 x 1° resolution, while CLIMAP (1981) has a 2 x 2° resolution, which is interpolated on the Cartesian grid of the ice-sheet model (50 x 50 km). The interpolation on the AGCM grid smoothes the elevation because of the coarser grid boxes. For temperature fields, we used a "reconstructed" temperature defined as the difference of temperature between the LGM and the control (from AGCM outputs), which is added to present climatology:
The reason for such a methodology is that the CLIMAP dataset only gives August and February SST, and it is better to keep a realistic seasonal cycle by using the "reconstructed" surface temperatures. These values are then corrected for the elevation difference (Altnew and Altold) to account for the better resolution of the ice-sheet model. The temperature gradient chosen is 8°Ckm -1 as observed in polar regions. Thus:
Using this method leads to negative values for some gridpoints in precipitation fields, so we used a ratio rather than a difference:
As previously noted, all LGM simulations have been performed using prescribed SST, which results, for the ice-sheet model, in a discontinuity in coastal regions' surface temperatures because these are computed over land by the model. This discontinuity has consequences for the hydrologic cycle, and to minimize them we use the AGCM surface air temperature at 2 m height that is computed for all gridpoints.
Accounting for all these problems before coupling, we performed three 20 000 runs using AGCM LMD5.3 and LMD4.3 outputs and the Reference PeltierPeltier (1994) reconstruction as boundary conditions, and the LMD4 outputs with the CLIMAP ice-sheet reconstruction. Fhe results are shown in Figure 5. Using LMD5.3 outputs, the ice-sheet model maintains the ice sheet, whereas with other runs, the Laur-entide and Fennoscandian ice sheets collapse. For the run coupled with LMD5.3 outputs, the best results are the maintenance of the Laurentide and Fcnnoscandian ice sheets in a steady state near the Peltier reconstruction and the absence of an ice cap over Siberia and Alaska, which is consistent wilh data for the LGM. A weaker point is the large accumulation decrease over Greenland, which leads to a lowering of the ice sheet. However, this may be due to the AGCM coarser grid at high latitudes.
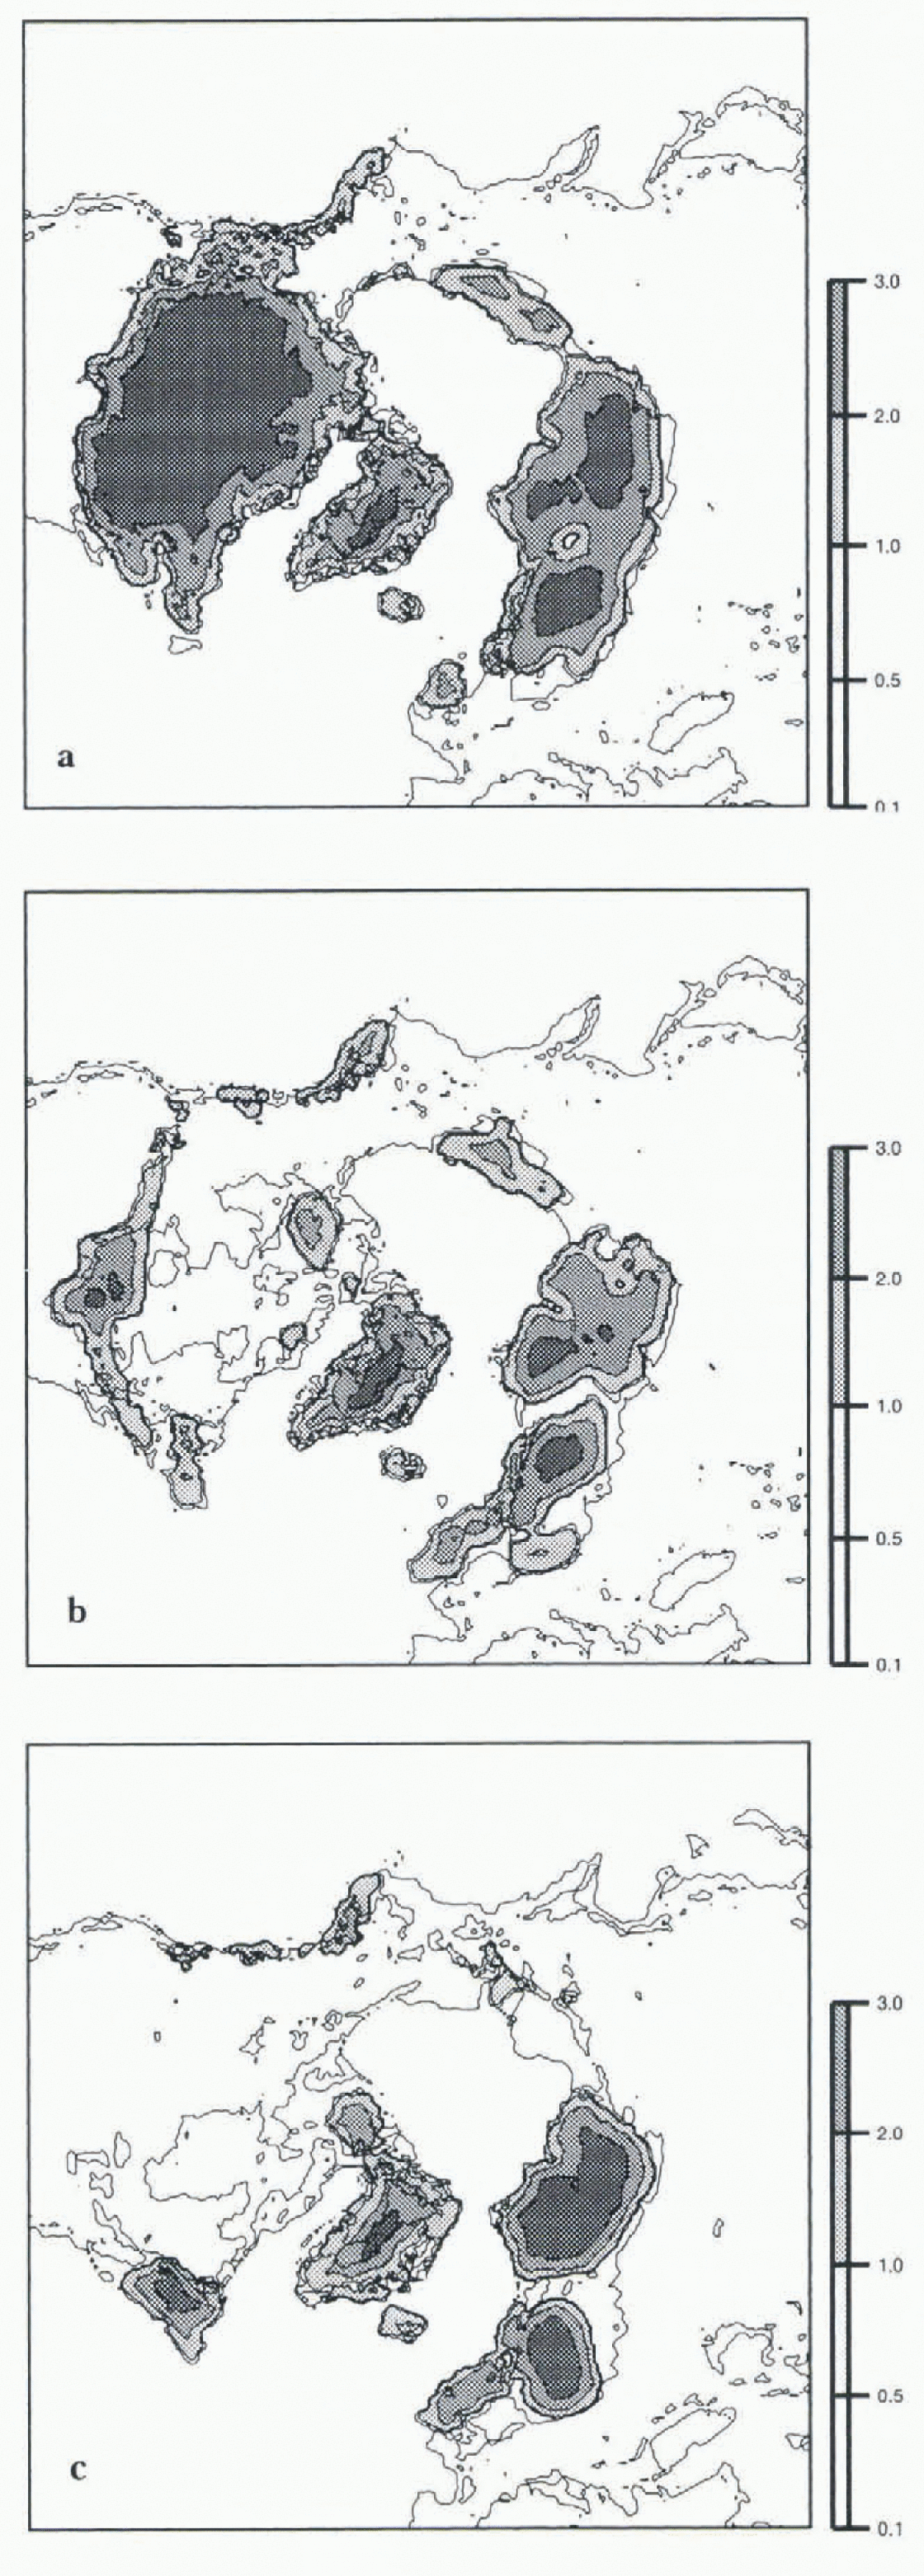
Fig. 5. Results of the ice-sheet model. The steady state is obtaned after 20000 years integration of the model. (a) Inputs are deduced from LMD5.3 outputs and Reference PeltierPeltier (1994) reconstruction is the initial condition. (b) inputs are deduced from LMD4.3 outputs and Reference PeltierPeltier (1994) reconstruction is the initial condition, (c) inputs are deduced from LMD4 outputs and CLIMAP (1981) reconstruction is the initial condition. The thin line represents the land oversea level.
For LMD4.3, the Fennoscandian and Cireenlancl ice sheets survive, despite an important lowering, but the Laur-entide ice sheet is reduced to a longitudinal belt on the westrn part of North America. This may be due to the pre-scribed CLIMAP (1981) SSTs. which give a warm pool over die mid latitudes of the north Pacific that are able to produce moisture that precipitates over the continent. Finally, LMD4 outputs show that, despite the fact that we start with the CLIMAP ice sheets that are 1000m higher, a weaker extent of the Laurentide ice sheet, but a slightly higher Fcnnoseandian ice sheet, are obtained.
The ice-sheet model is therefore very sensitive to AGCM outputs. The best result is obtained with LMD5.3 In this approach, whereas in the previous approach, the weaker ice-sheet mass balance was obtained for LMD4.3
Conclusions
We investigated, through two different methods, the mass balance of the ice sheets for the LGM. We expect little or no net snow accumulation. Are these tools able to tell us whether the prescribed ice sheets (Peltier or CLIMAP are in equilibrium or near the equilibrium wilh the computed LGM climate? The answer to this question is not clear cut because our results suggest that the conclusions vary depending on the methodology used. Moreover, these results are very different from those of Reference Hall, Valdes and DongHall and others (1996) who found that for the model developed by the UK Universites' Global Atmospheric Modeling Program, the maintenance of ice sheets was due to a net accumulation in the central part and a melting at the edges. In the present research, we found that there is siill accumulation over the ice sheets at the LGM. However, these results are quite different for the LMD5 and LMD4 versions. LMD5 surface temperatures are colder and always below freezing, which leads to a decrease of evaporation and to a high accumulation. In the other model versions, the summer temperatures are above freezing point and ice-sheet mass balance is reduced to lower values.
In the method using LGM AGCM inputs and an ice-sheet model, the best result is obtained with LMD5.3 inputs, which is the only one that maintains the ice sheet. The fact that this version is the best candidate to maintain the ice sheet is not surprising because it has the highest accumulation and also the highest resolution. What is puzzling is why the LMD4.3 version, which from the direct approach seems the closest to a zero mass balance, gives such poor results when using an ice-sheet model. There are two main reasons. First, in the direct approach the high LMD4.3 summer surface temperatures enhance summer melting, which partly compensate for winter snowfall, but in the coupled approach we use 2 m height air surface temperatures that strongly dampen the summer temperature differences between the LMD5.3 and earlier versions. Secondly, the coarser grid of the LMD4.3 version is more difficult to couple with the smaller ice-sheet Cartesian grid, especially when using precipitation.
A way to avoid the first problem is to use a LGM simulation with computed SSTs that will allow us to use directly the surface temperature in the iee-shect model. This simulation has already been performed, and will be coupled with the ice-sheet model. A major advance in this topic should be achieved through the Ice Sheet Mass Balance Sub-Project led by D. Pollard in the framework of the PMIP program (Reference Joussaume and TaylorJoussaume and Taylor, 1995). More than 15 model results for LGM simulation using the same boundary conditions, will then be analyzed in terms of ice-sheel mass balance.
Acknowledgements
We gratefully acknow ledge the Laboraloire de Meleorolo-gie Dynamique (CNRS, Paris, France for providing us with their GCM, J. Jouzel for fruitful discussion, D. Lewden for participating in the simulations and J. Y. Peterschmit (LMCE) for the graphic outputs.


